/
Email Exchange
Email Exchange
- Charles Bishop (Deactivated)
Owned by Charles Bishop (Deactivated)
Jan 30, 2018
Analytics
Loading data...
The Email Exchange application helps you analyze the emails that you receive and send. You can see who you frequently communicate with, who sends you valuable messages, and who is involved in the longest threads.
Infographic
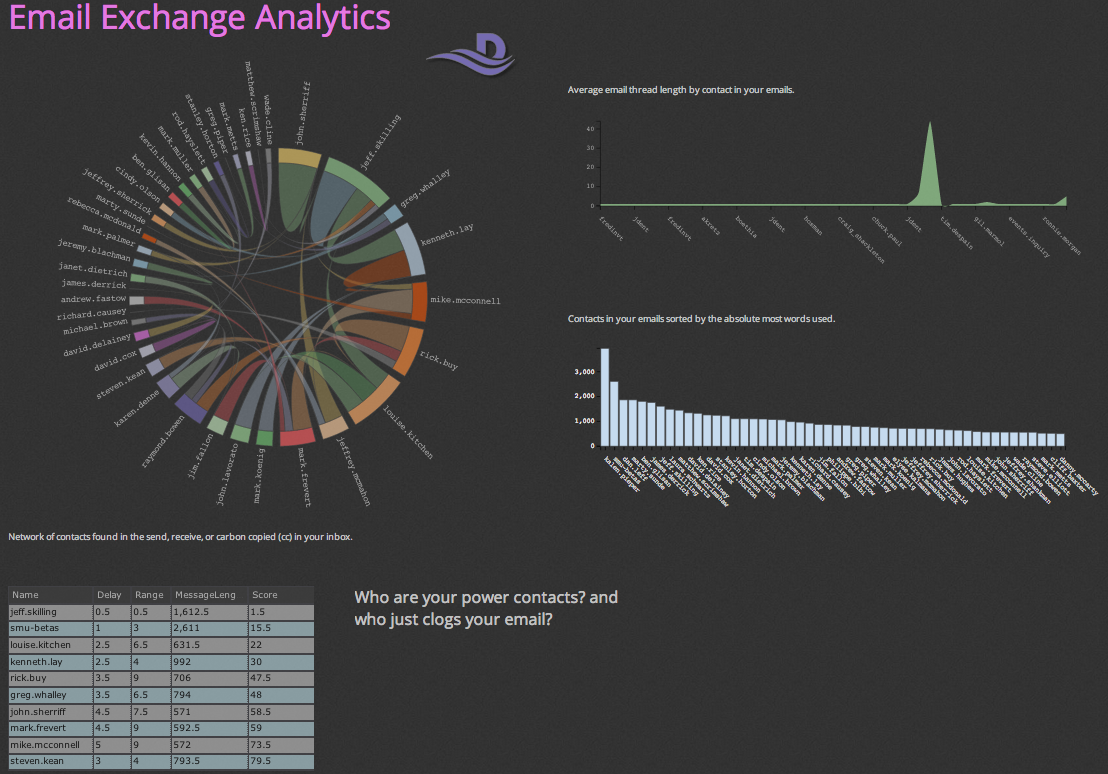
The infographic contains the following four widgets to help you understand the value of your email exchanges:
- The first circular network widget shows the relationship between people that you send or receive mail from, based on how many emails are shared between your peers.
- The stream area chart illustrates the average length of email thread sorted by contact.
- The multi bar chart shows which contacts have sent you the most words in their emails.
- The table makes is clear who is sending you the longest emails and ranks them to give you a clue about who your most valuable contacts are.
Configuration Instructions
Enter your email and password.
If you are trying to use this app with Gmail, you might need to create an application-specific password.
- Use Unlock Captcha (https://accounts.google.com/DisplayUnlockCaptcha) to allow Datameer to access your Gmail account.
- If you are using 2-Step-Verification, set up an app password for Datameer.
- Enter your new app password in the Email Password field the Installing Email Exchange page.
- On the Installing Email Exchange screen, select a folder to pull emails from.
- Specify a Start date and End date in their fields to identify which emails should be used in the app.
Connection and Import
The app uses the Inbox import and your email address to connect to an email server.
Workbooks
The application uses four workbooks to complete analysis:
- The exchange_complete workbook is primarily used to collect the data that then separated into the other workbooks. It performs many of the calculations, such as GROUPBY, joins, or filters, to prepare the data for the other calculations and use in widgets.
- The exchange_analysis workbook is used to create the circular network widget, where the email sender and receiptient information is collected in the Exchange_Summary sheet and then sorted in the Top_Exchange.
- The data in the _exchange_summary_stats workbook is used in the table and multi bar chart widgets. The data is combined and sorted in the LongestMessage sheet to feed the multi bar chart widget. In the TopScore sheet, the scoring data is sorted to generate the table widget.
- The exchange_thread workbook calculates the data for the stream area chart by grouping the emails by subject and sender, then counting the number of replies.
, multiple selections available,
Related content
Email Delivery Analysis
Email Delivery Analysis
More like this
Email Communication
Email Communication
More like this
Enron Email Analytics
Enron Email Analytics
More like this
Marketo Metrics
Marketo Metrics
More like this
Network Intrusion Detection
Network Intrusion Detection
More like this
Twitter Analysis
Twitter Analysis
More like this