Visualizing Data
- Charles Bishop (Deactivated)
Creating infographics is how you generate and view dynamic reports. Once you create an infographic, you can easily view it at any time by clicking on folder where the infographic is stored and selecting the file you want to view. The content in the inforgraphic is updated when the corresponding workbook is recalculated.
You can share your infographics with other people and groups as well as adjusting the file ownership in the security settings.
Infographics Overview
Infographic widgets are interactive tools that allow you to access and view your data in different ways.
You can choose from the different types of widgets including graphs, maps, charts, tables, and more.

Each widget is linked to data from a workbook. You need to run the corresponding workbook before you can configure the widget to display that data. The data that is available to the widget is based on selections made in the Save Workbook settings. See Configuring Workbook Settings to learn more.
Creating A New Infographic
To set up a new infographic:
- Click the + (plus) button and select Infographic or right-click in the browser and select Create new > Infographic. You are now in the infographic creation screen.
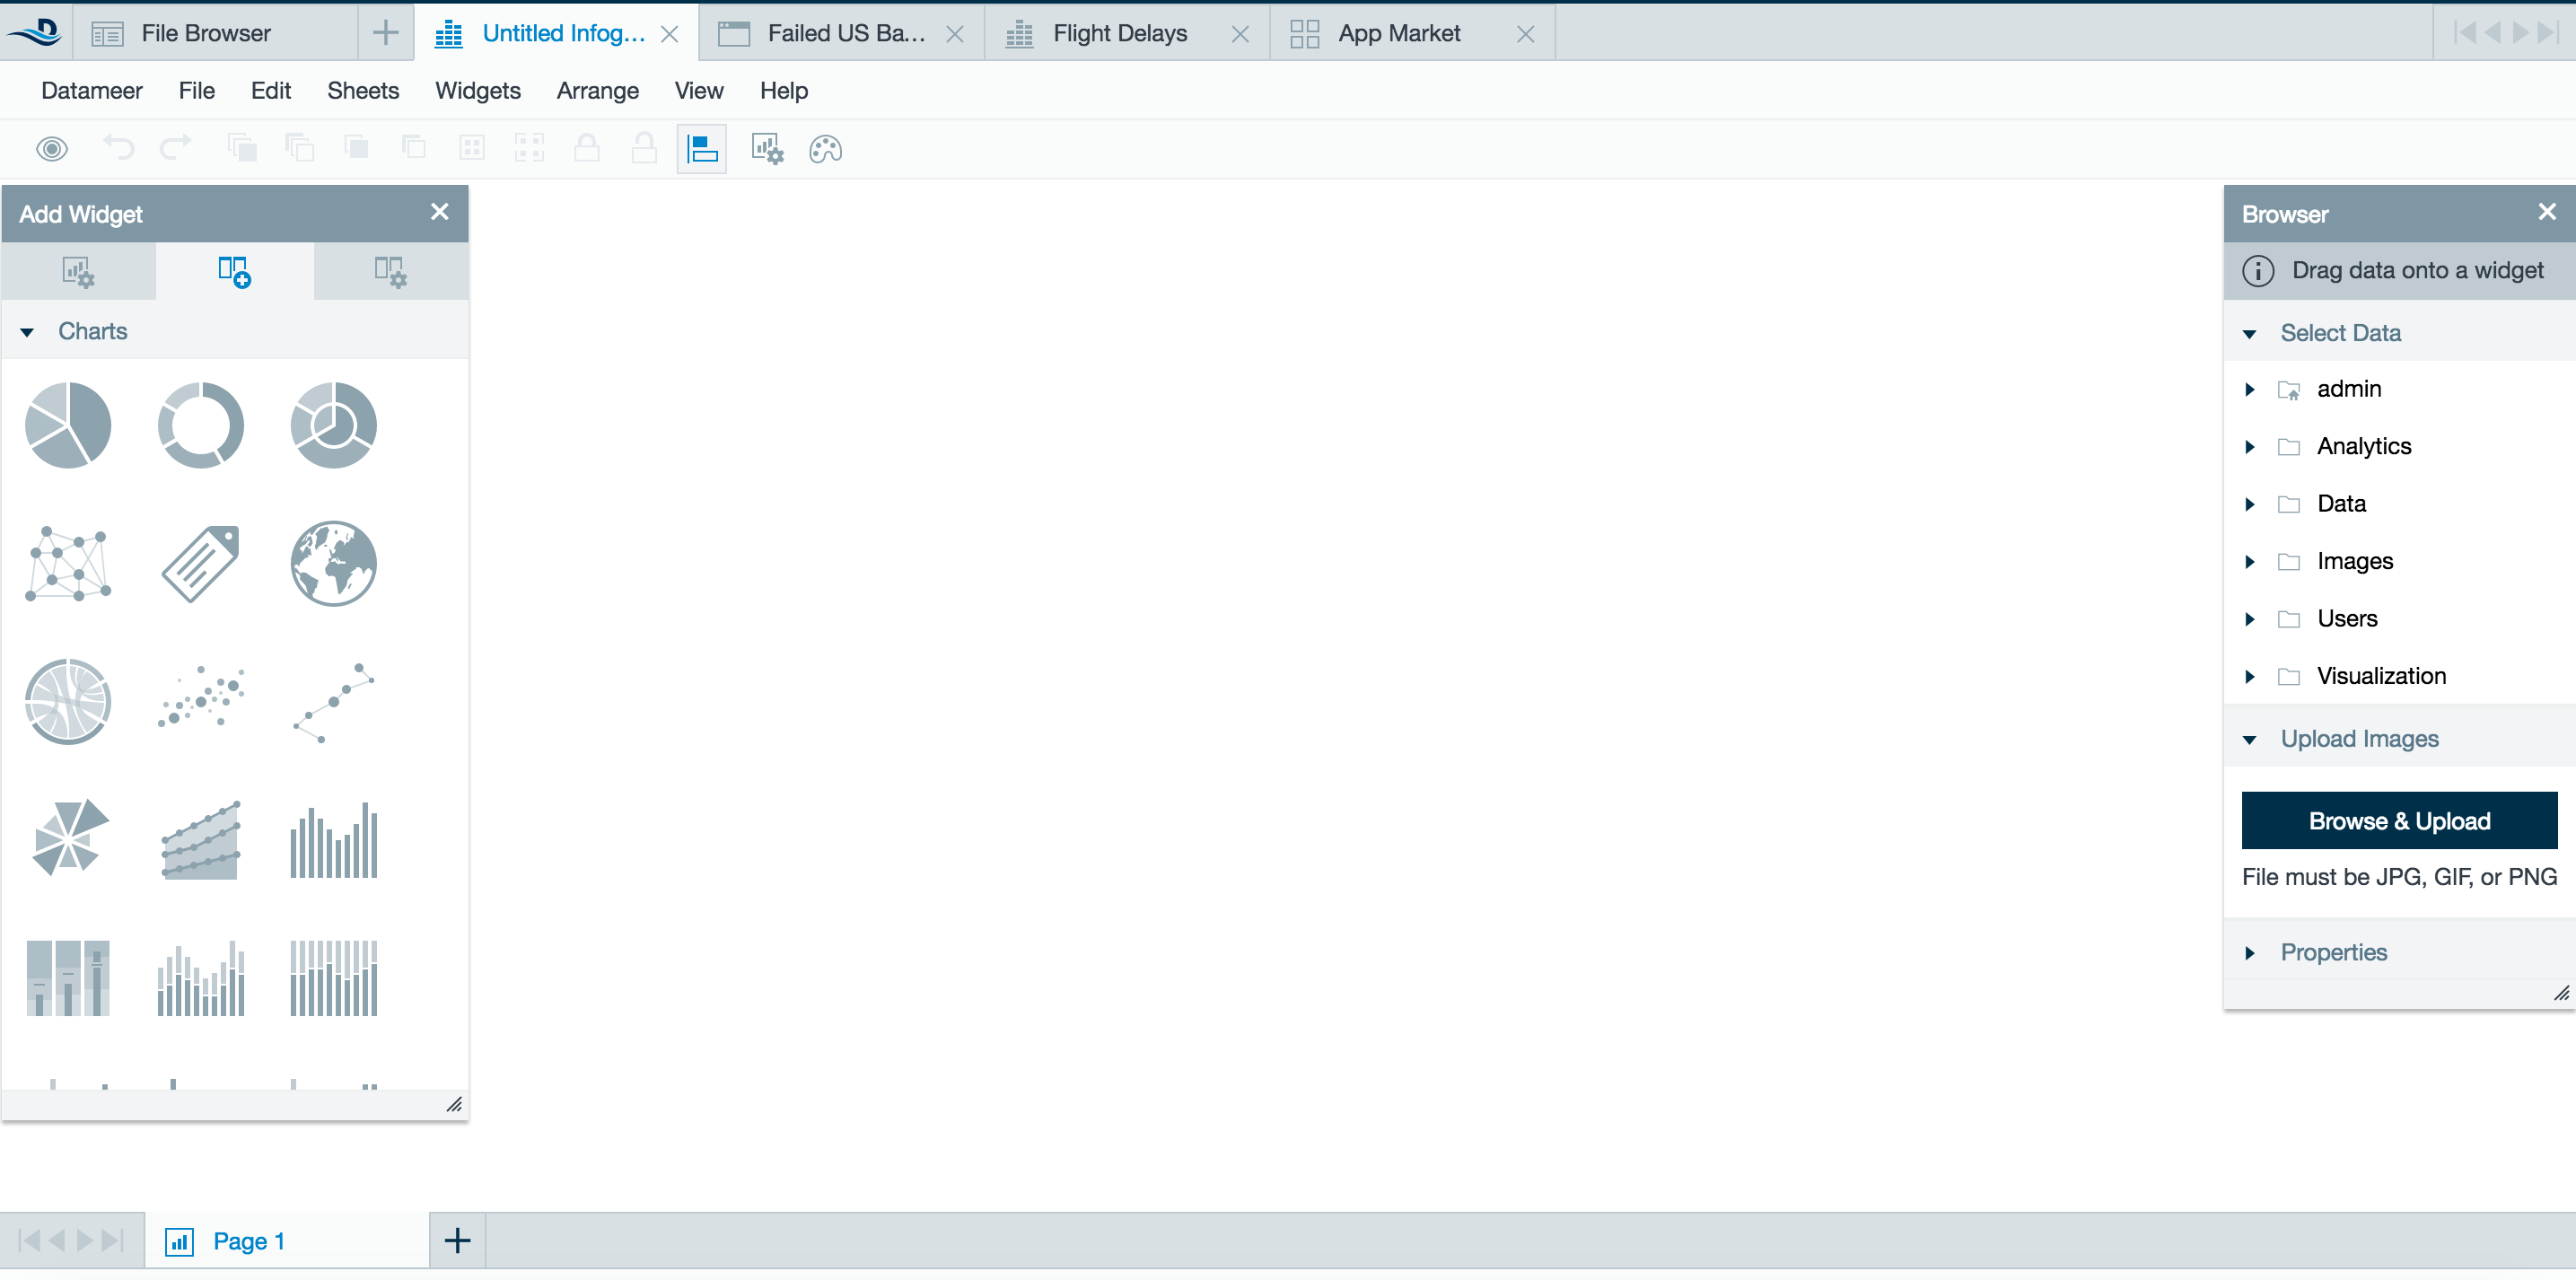
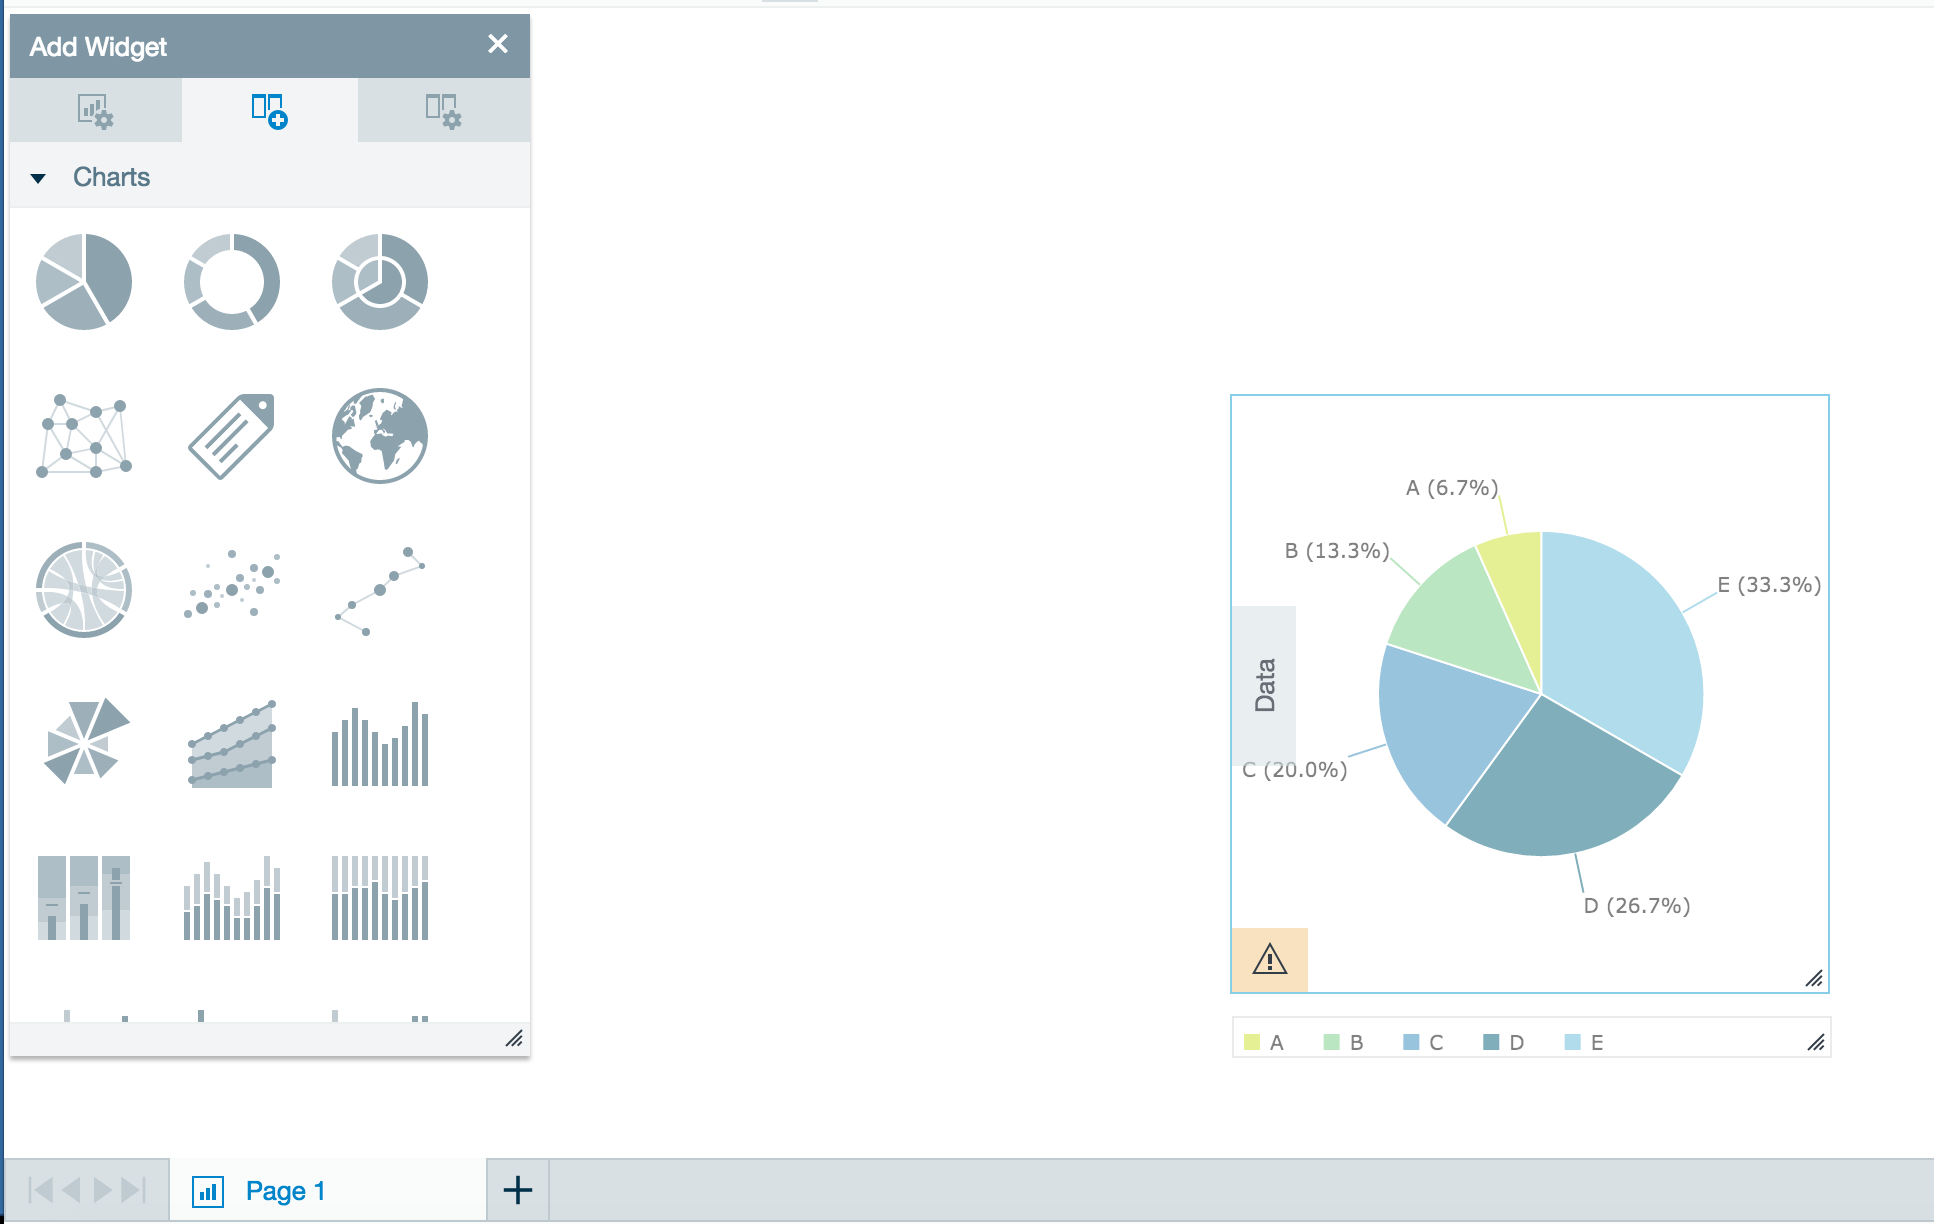
- To start building an infographic, select the type of widget from the widget toolbox and drag and drop it in the middle of the page.
- Click the Data tab on the left side of the new infographic to show which properties need to be entered for the configuration.
- Specify who else can view or edit this graphic by clicking Infographic Settings in the toolbar and opening Sharing. Specify what type of access all users have (view or edit).
You can make this graphic open for public viewing by selecting the Make Public checkbox.
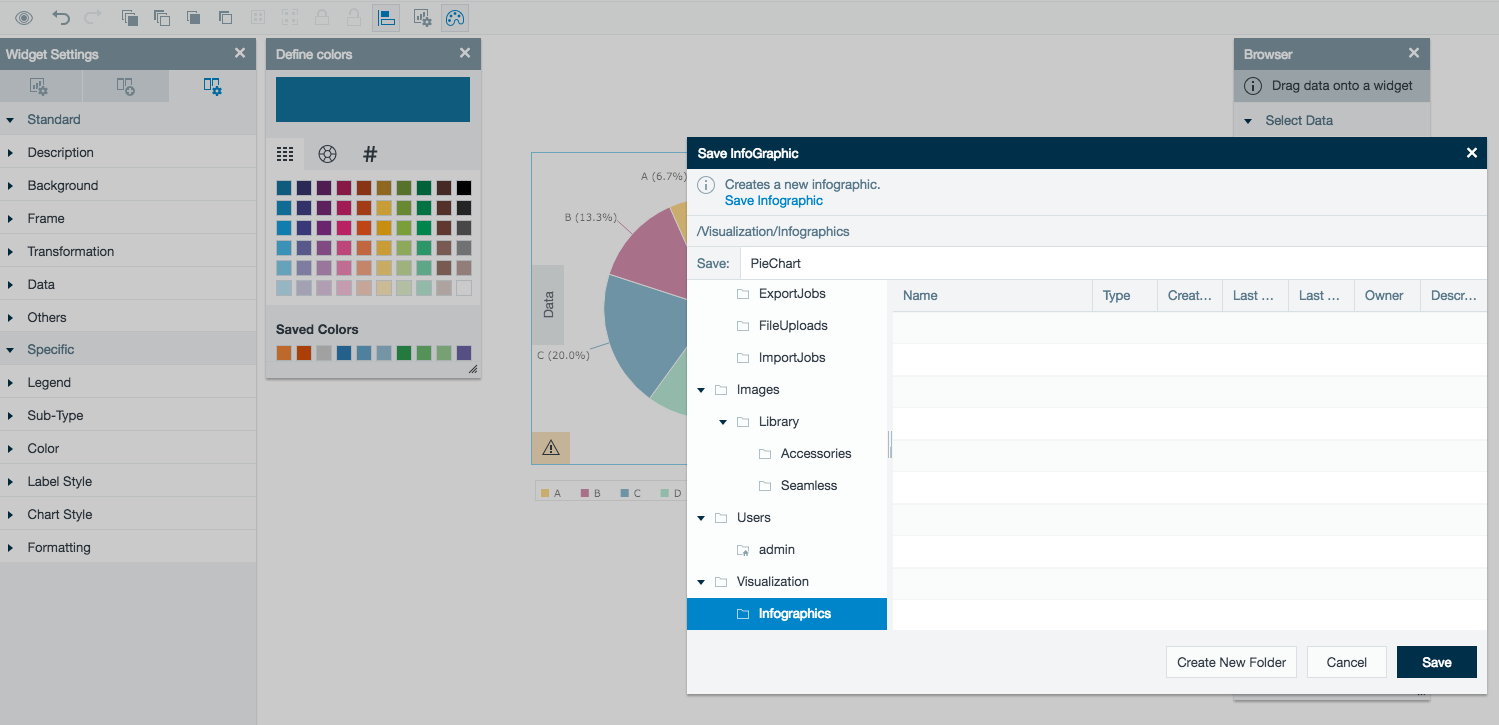
- Click Save, then select the location and enter a name for the Infographic, and click Save again.
Infographic Tabs
You can open multiple tabs to place and configure widgets. Each of these tabs are separate from each other and can have different background and widgets used in them. Infographics from one tab can simply be copied and pasted to another tab. 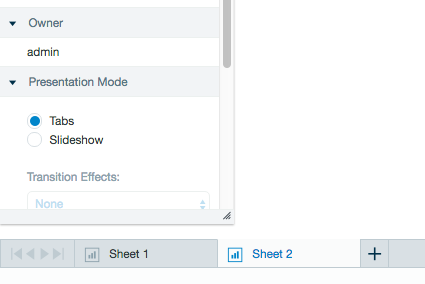
Selecting and Configuring Widgets
Selecting a widget
After the infographic page has been loaded, you can select and configure the widgets to use in the infographic. See Create a New Infographic to learn how to set up an infographic.
To select widgets:
- To open the widget toolbox, click Add Widget on the toolbox or from the Widgets menu.
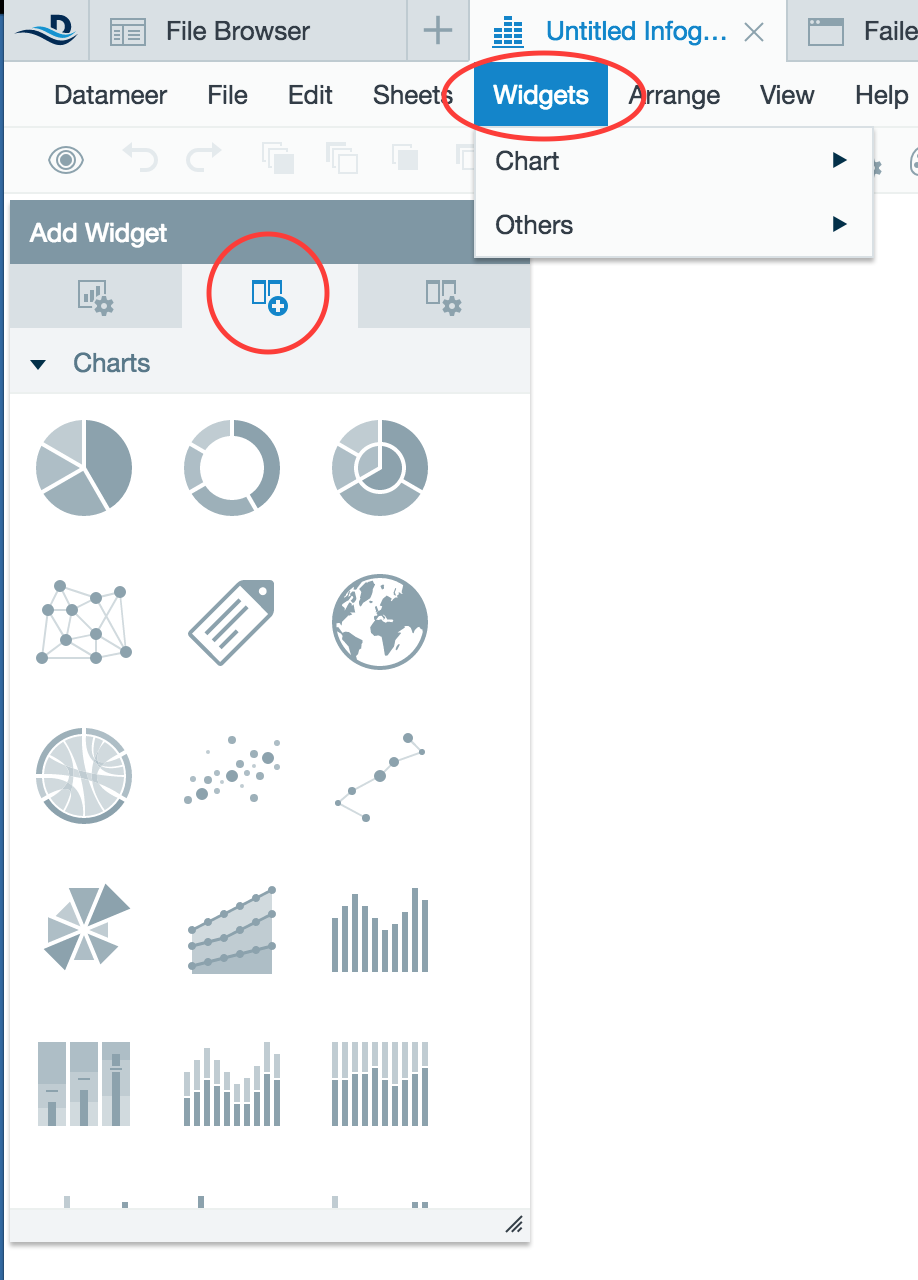
- Click a widget from the list of available widgets in the left toolbox. Drag and drop the selected widget into the workspace.
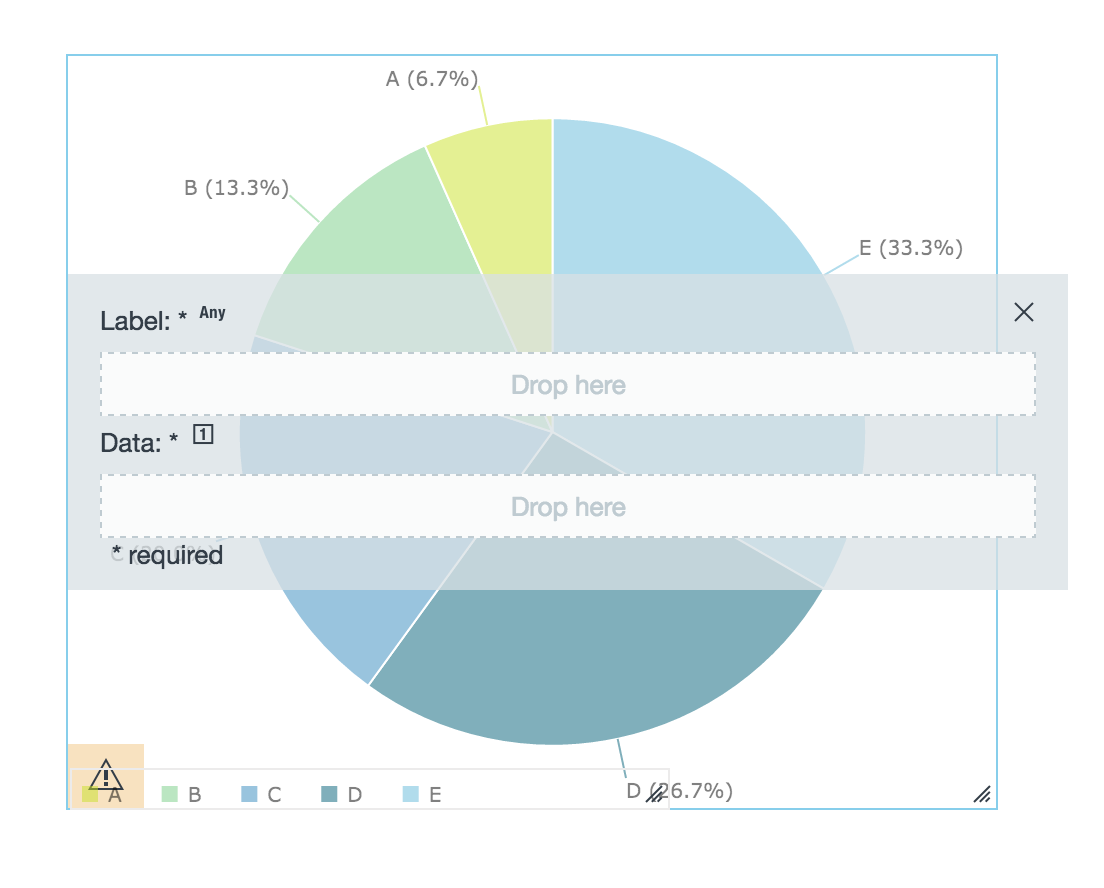
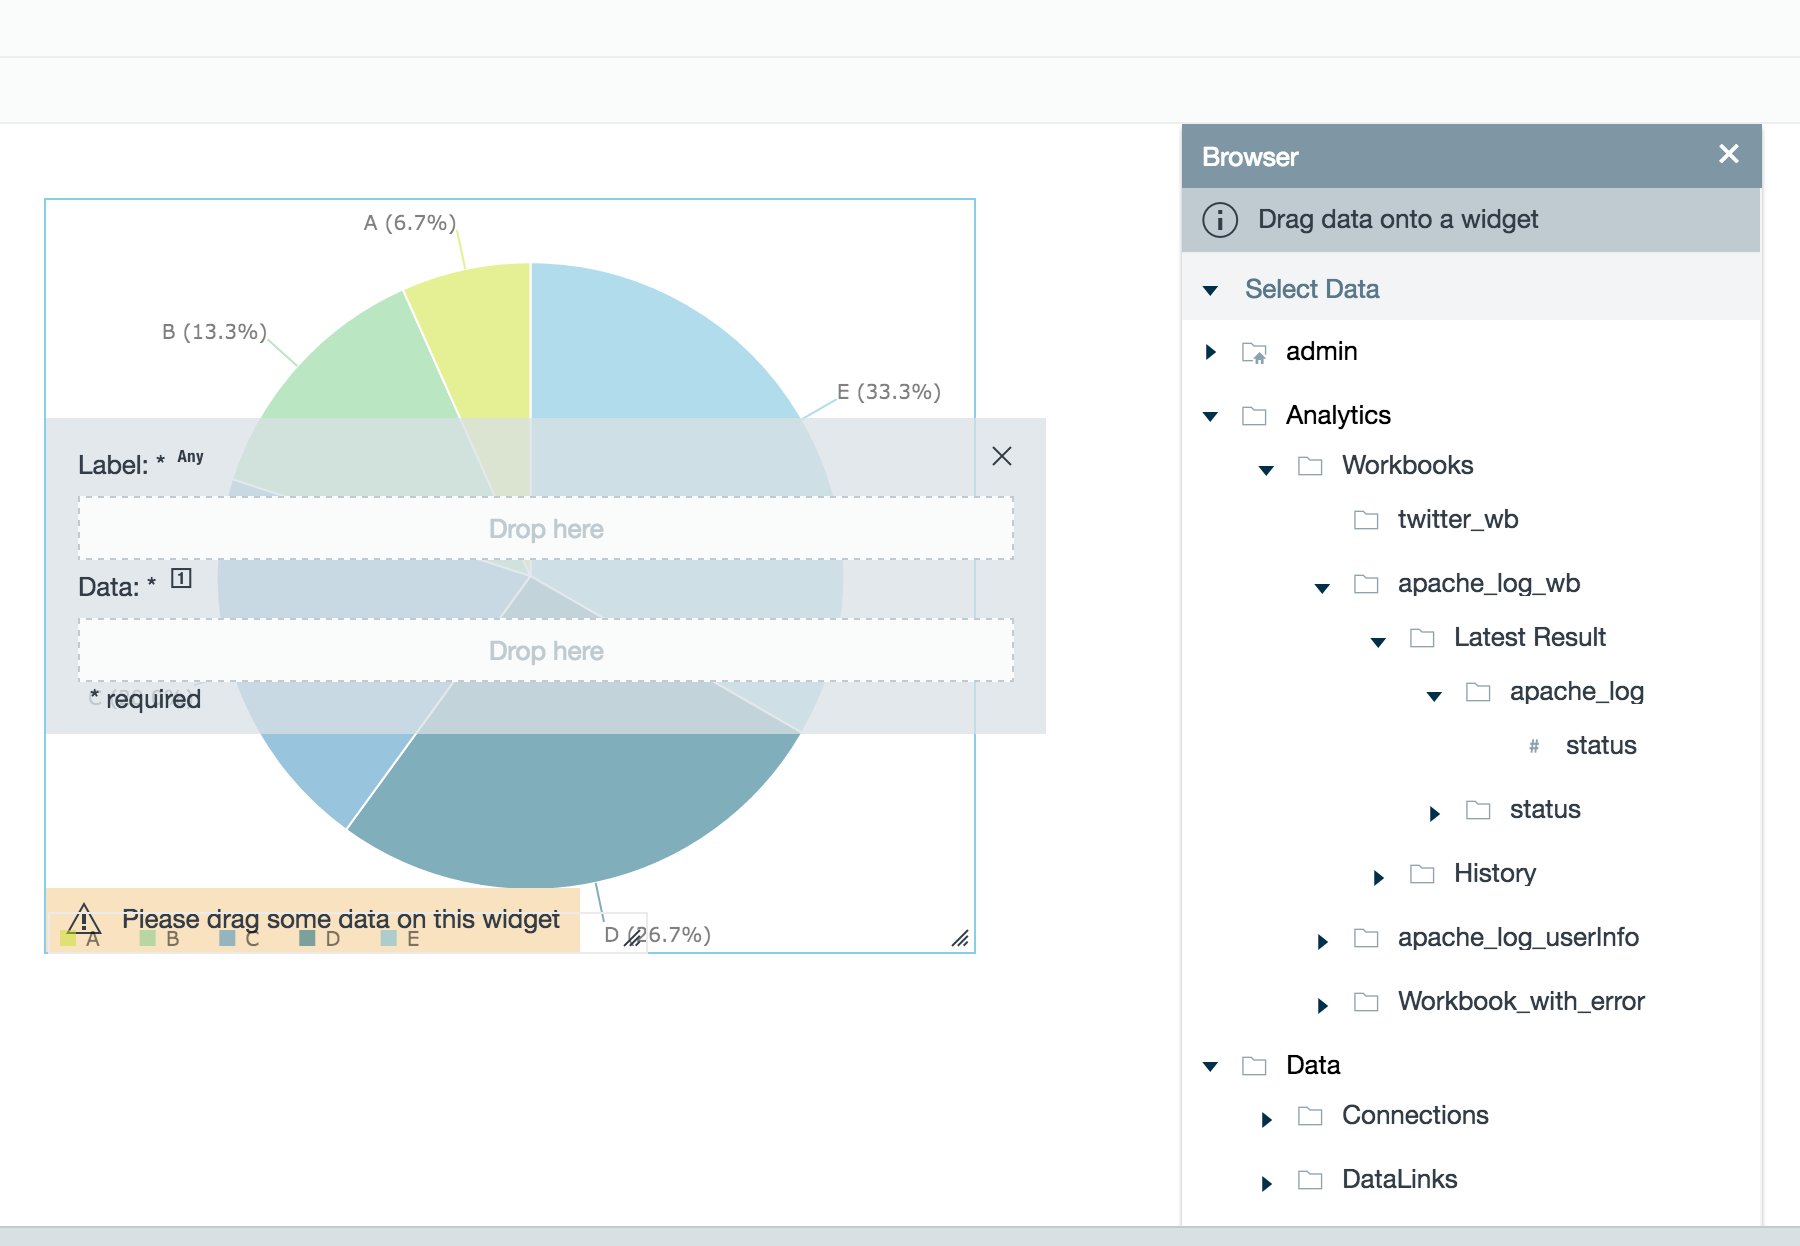
- Click the Data tab to show which properties need to be entered for the configuration.
- Find the data to add to the infographic and drag and drop the data into the corresponding fields in the widget.
Configuring widgets
Looking for a how to on configuring a specific widget? Go to Types of Infographic Widgets.
- Load or create an infographic from the File Browser tab.
- To open the widget settings, click the Widget Settings option.
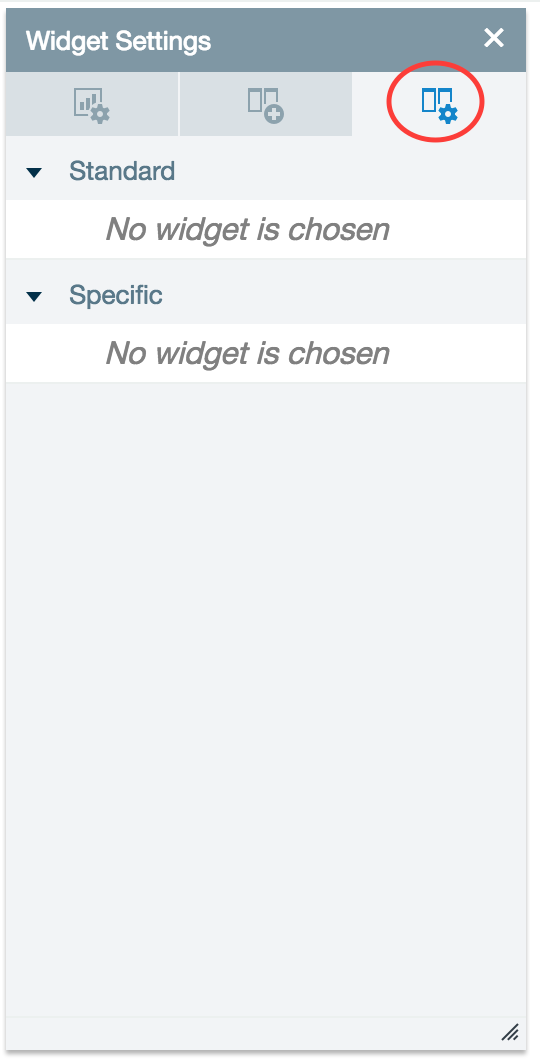
The widget settings are separated in two categories: Standard and Specific.
Standard settings
The following standard settings are available for all widgets.
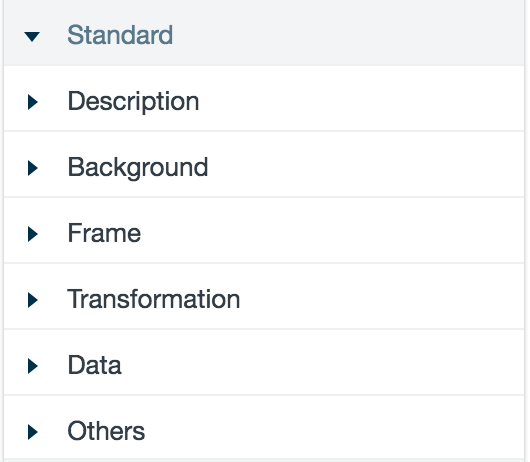
- Description. Add a description to the widget.
- Background. Add a solid color or an image as a background to a widget.
- Frame. Frame a widget and choosing a color for the frame.
- Transformation. Adjust the side of the widget width and height, position of the widget on the page,
- and rotation of the widget.
- Data. Limit the number of data points shown.
- Others. Change the opacity of the widget.
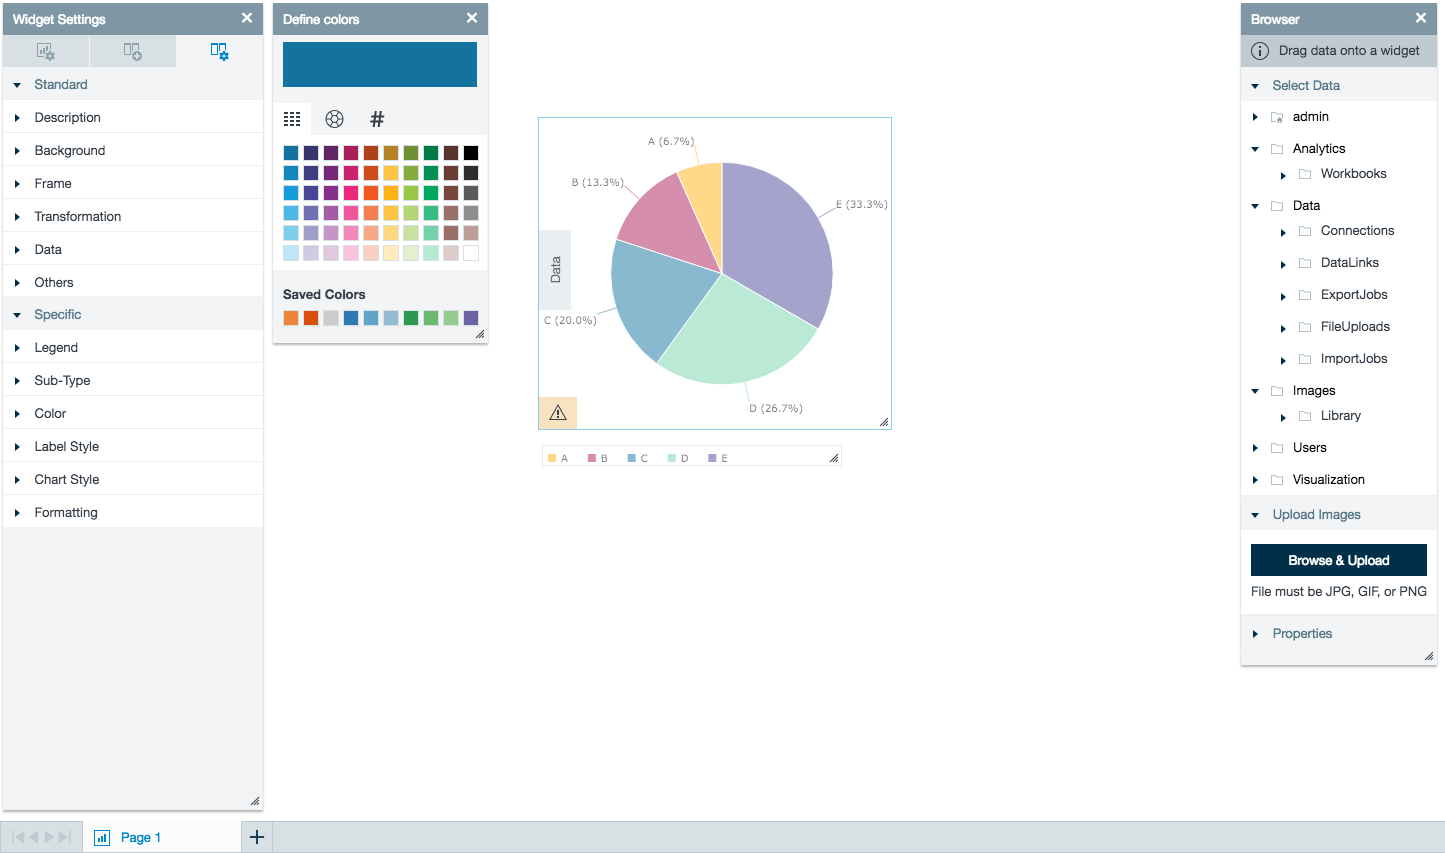
Specific settings
The specific widgets settings are dependent on the widgets being customized.
As an example, these are the specific widgets settings of a pie chart:
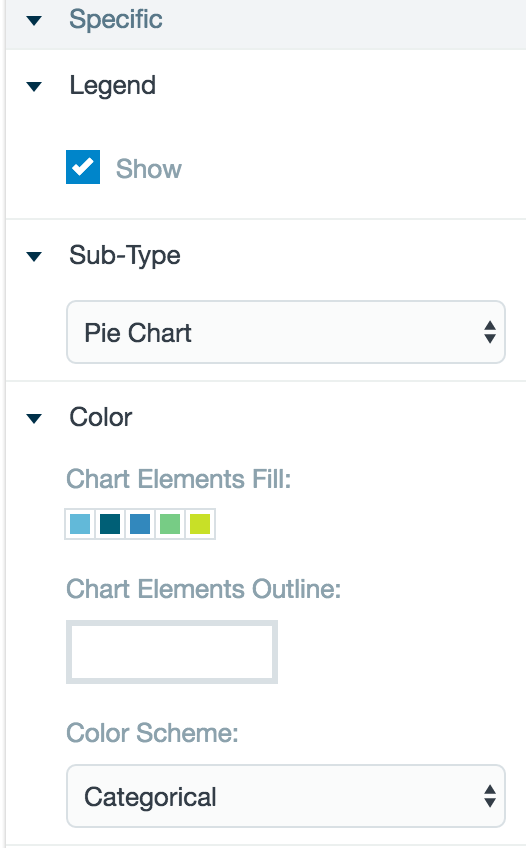
- Specific Settings
- Legend. Choose to include a built in legend for the displayed data in the infographic.
- Subtype. Select different chart/graph styles from the drop-down menu.
- Color. The top color bar shows the current colors being used in the widget. Clicking on a box and selecting a new
color changes the corresponding widget color. Specify the color of the lines in a widget, or choose a flat, gradient, or categorical color scheme.
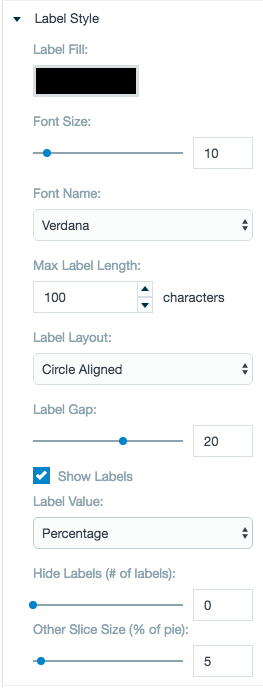
- Label Style Settings
- Specify the color of the labels.
- Choose a font size.
- Choose a font type.
- Create a max label length to make text easier to read.
- Choose from different how the labels for the widget are displayed.
- Designate a gap size between labels.
- Ability to turn labels off and on.
- Choose to display labels with numerical values, percentages, or as plain text.
- Option to hide labels with smaller values.
- Merge smaller values into an other category.
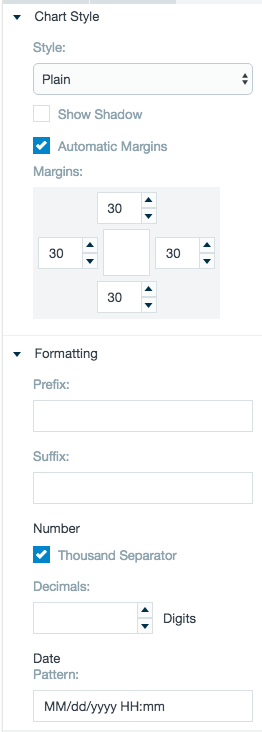
- Chart Settings
- Chart Style. Add a style to a widget. Change the widget between plain, a foggy, or glossy to give the widget a 3D look.
- Add a shadow to the widget to get it depth.
- Specify the margins.
- Formatting. Add a prefix or suffix string to the labels of the widget.
- Number. Add or remove a comma separator between thousand's places for displayed numbers. Specify the amount of numbers to display after the decimal in the widget.
- Date.Specify a data pattern to display date values within the widget.
The changes made to the widget settings take place immediately.
- To save changes made to a widget, click File > Save/SaveAs.
- Saving an infographic for the first time or choosing the Save As option prompts a box asking for a save location. The default save location is the Infographics folder but you can specify any location to save your data visualizations.
Infographic Tool Bar

At the top of the visualizations page under the menu bar is a tool bar for convenience while creating infographics. Check out the tool bar options below.
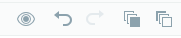
- Eye. Sets view mode, which removes all setting and tool bars from the screen for a clear view of the infographic.
- Left arrow. Undoes the last command.
- Right arrow. Redoes the last command.
- Bold front sheet (three). Brings the infographic to the front.
- Bold back sheet (three). Sends the infographic to the back.
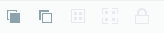
- Bold front sheet (two). Sends the selected infographic forward.
- Bold back sheet (two). Sends the selected infographic back.
- Grouped square. Groups the selected infographics.
- Ungrouped square. Ungroups the selected infographics.
- Lock. Locks the infographics that aren't selected.
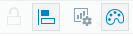
- Two widgets. Unlocks all infographics.
- Widget settings. Opens the infographic settings.
- Palette. Allows you to select colors for the infographic.
Editing and Viewing Infographics
Edit infographics
To edit infographics:
- Click the File Browser tab.
- Navigate the file browsers on the left side of the page to the graphic file.
- Right-click the infographics and click Configure.
- Make changes and click Save.
To view infographics:
- Click the File Browser tab.
- Navigate the file browsers to the graphic file.
- Right-click the infographics and click Open or double-click the infographic.
- The infographic can changed to editing mode by clicking the Infographic menu and selecting Edit.
Placeholder image
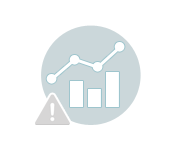
A placeholder image appears in both edit and view modes when a problem occurs between the widget and the source of its data.
Reasons a placeholder image might appear:
- A widget hasn't been configured with data. (50% opacity mock data displayed in edit mode)
- Data no longer exists from the datasource.
- Data no longer exists from the workbook.
- The data being used has an error.
Infographic Information
- Click the File Browser tab.
Navigate the file browsers on the left side of the page to the graphic file. Right-click the infographic and select Information. The information screen is on the right side of the screen and split up into two categories: Information and Security.
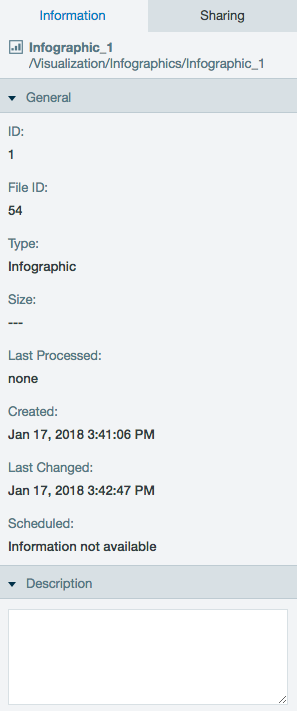
- File information. Name of the file.
- File path. Where the file is stored.
- General. General information on the file included the ID, FileID, Type, and Size.
- Description. Description box that can be edited to describe the file.
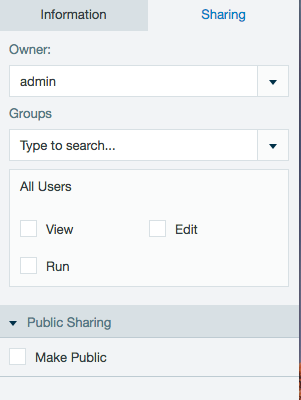
- Owner. Displays the owner of the file.
- Groups. Displays which groups have access to the file and their view/edit/run permissions for the file. Allows for multiple group addition for access the file.
- All Users. Set file permissions for all users in Datameer.
- Public Sharing. Click to create a URL on the network where Datameer is hosted that can be shared with anyone able to access that network. (Example: If Datameer is hosted on an internal network then only those who can connect to that network will have access to the shared infographic. If your Datameer instance is hosted on the cloud you can share it with anyone.)
Duplicating Infographics
- Click the File Browser tab.
- Navigate the file browsers on the left side of the page to the graphic file.
- Right-click the infographic and click Duplicate.
Renaming Infographics
- Click the File Browser tab.
- Navigate the file browsers on the left side of the page to the graphic file.
- Right-click the infographic and select Rename.
Sharing Infographics
To share infographics:
- Click the File Browser tab.
- Navigate the file browsers on the left side of the page to the graphic file.
- Right-click the infographic and select Information.
- The information box is located on the left side of the screen.
- Look at the sections on Sharing/Public Sharing
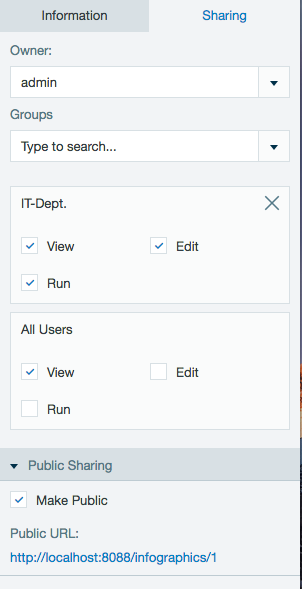
- Owner. Owner of the file is listed.
- Groups. Add group(s) to access the file. Groups with access to the file are listed. Check marks designate which permissions each group has with the file.
- All Users. Set permissions for all users in Datameer.
- Public Sharing. Click to create a URL on the network where Datameer is hosted that can be shared with anyone able to access that network. (Example: If Datameer is hosted on an internal network then only those who can connect to that network will have access to the shared infographic. If your Datameer instance is hosted on the cloud you can share it with anyone.)
Tab-specific URLs
Every individual infographic tab will have a unique URL. Users can use this URL to bring those they share the file with to a specific tab within the the infographic.
Example:
URL = <host name>:<port>/infographics/<id>#tab-3
This URL links directly to the 3rd tab of the infographic specified by the ID.
Security sharing settings must be set to share infographics and those able to access the target tab in the file can access all tabs for the infographic. The Public Sharing link can be emailed or posted to allow others to view the infographic.
Deleting Infographics
To delete infographics:
- Click the File Browser tab.
- Navigate the file browsers on the left side of the page to the graphic file.
- Right-click the file and select Delete.
- Click Delete in the confirmation box to confirm deletion of the infographic file.
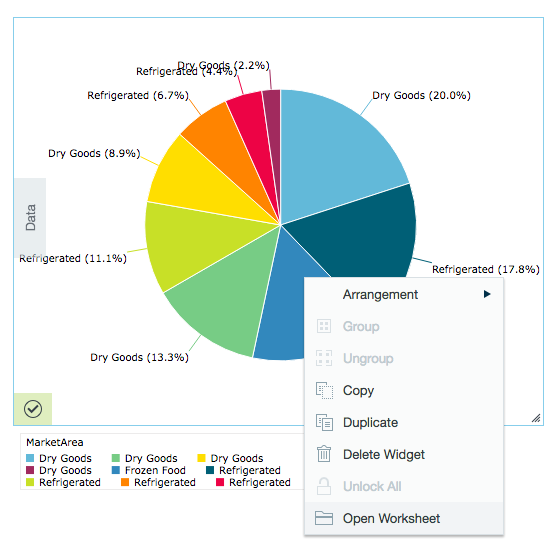
Opening a Worksheet from Infographic Widget
To open a worksheet from an infographic:
- Save the infographic.
- Right-click on the infographic in either view or edit mode.
- Select Open Worksheet.