Set Up Runtime Analytics
Runtime Analytics Basics
Runtime Analytics (RTA) is a patented Datameer processing engine for sub-second aggregation of massive datasets that enable instant response to analytical queries through Datameer's Visual Explorer.
RTA keeps a persistent container running on the cluster that indexes a dataset, leveraging the best of columnar stores for fast data access and on-demand, in-memory indices in real-time (Lazy Indexing). Combined with fully distributed search technology it provides exceptionally fast aggregation, filtering, and faceting capabilities on volumes of data comprising billions of records. By removing the need for precomputed indices, RTA allows for unconstrained data exploration without straining compute and storage resources.
If you do not have the RTA module, contact support@datameer.com for purchase information.
Visual Explorer
The Runtime Analytics plug-in is required to utilize the Visual Explorer feature in Datameer. Visual Explorer is an interactive data analysis feature designed to quickly and easily understand your data. With the purchase of Visual Explorer, you can instantly explore up to billions of records with sub-second response times when optimally configured. The data is first displayed visually over different types of charts where you can drill in and add/adjust attributes or aggregations. When the initial data exploration has been completed, the findings are added to a worksheet within your workbook where further analysis can be made. Visual Explorer integrates with Hadoop via YARN working seamlessly on multi-tenant clusters.
Deployment
System Requirements
A Hadoop cluster for a currently supported Hadoop vendor.
If the cluster is shared across other Datameer jobs and other Yarn applications, it's recommended that each Hadoop node has at least 16 vcores and plenty of memory depending on the datasets (see capacity planning).
When deploying with cloud Hadoop vendors, the following instance types are good starting points (and also account for additional memory requirements).
- AWS: EMR: c4.4xlarge (or newer equivalents)
- Azure: HDI: d5v2 (or newer equivalents)
Queues and preemption
RTA provides Datameer administrators the option to launch the RTA Yarn App in a completely separate Yarn queue. This can be helpful for oversubscribed Hadoop clusters because Yarn applications launched in queues with a higher priority can start cannibalizing other Yarn applications provisioned in lower priority queues.
If response time and stability are important for a particular RTA deployment, it is highly recommended that RTA is deployed in a Yarn queue that is exempt from scheduler preemption rules in Hadoop.
Resource management
RTA requires and operates with a fixed amount of memory and containers that are configurable. Once RTA is started and successfully allocates its configured resources, it it will fully support the analytical queries sent to it. In Hadoop clusters that are shared with multiple types of applications and operating at high capacity, it can be difficult to reacquire resources that have been allocated to RTA.
Preferred upgrade path
Starting in Datameer 6.3, Datameer stores job outputs as Parquet files. If upgrading from 5.11 or 6.1, customers must re-run targeted workbooks for Visual Explorer support. Customers upgrading from 6.3 or 6.4 should already have data for job outputs in Parquet format.
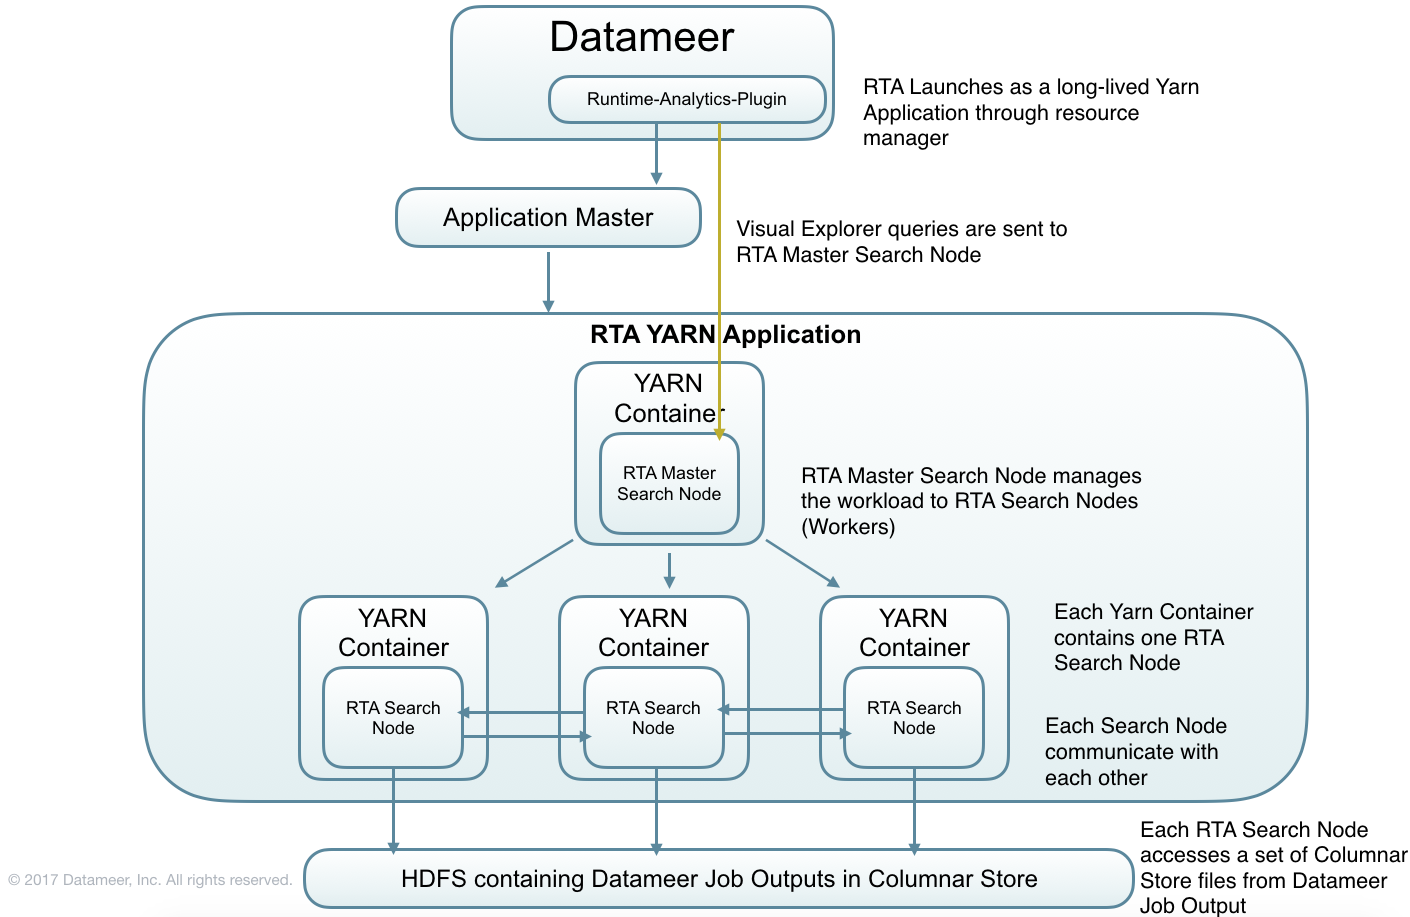
Deployment architecture
Configuring and Enabling Runtime Analytics
Steps to install and start Runtime Analytics
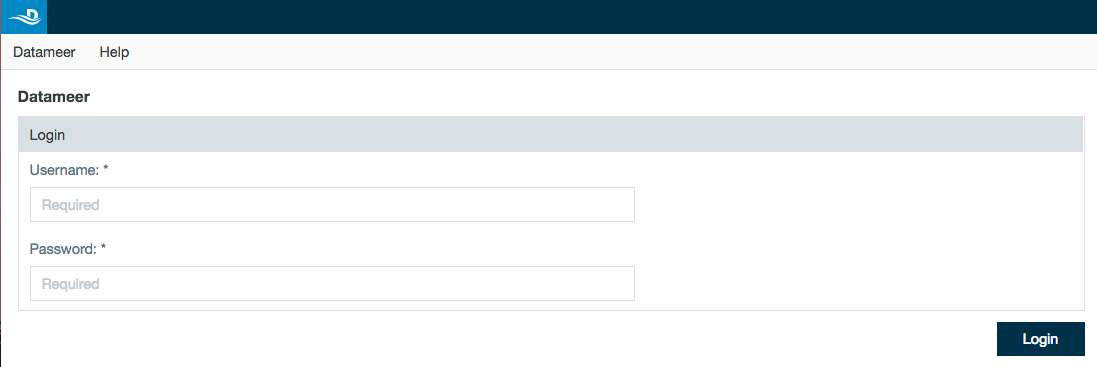
- Log in to Datameer through the user interface.
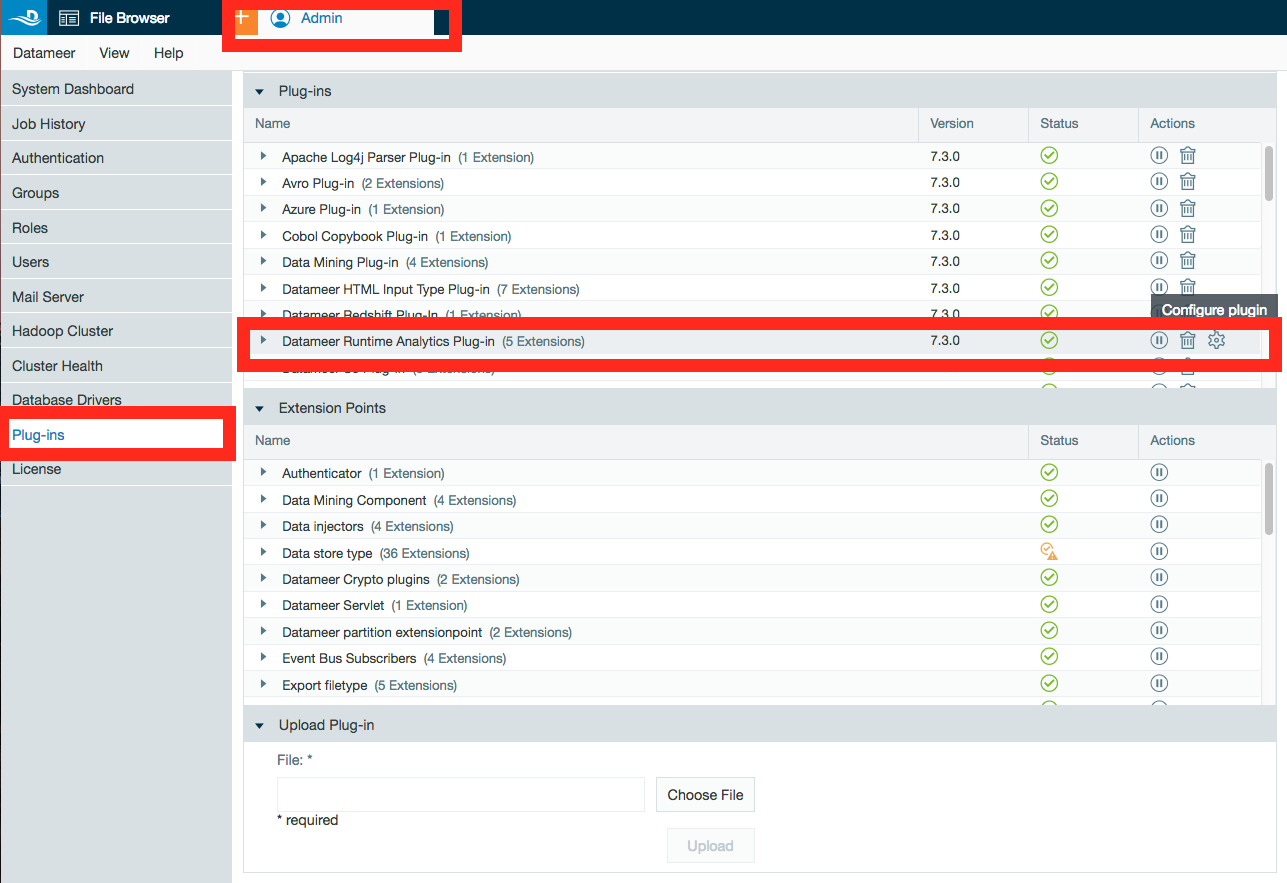
- Open the Admin tab.
- Select Plug-ins from the side menu.
- Find Datameer Runtime Analytics Plug-in and click the gear icon to configure the plug-in.
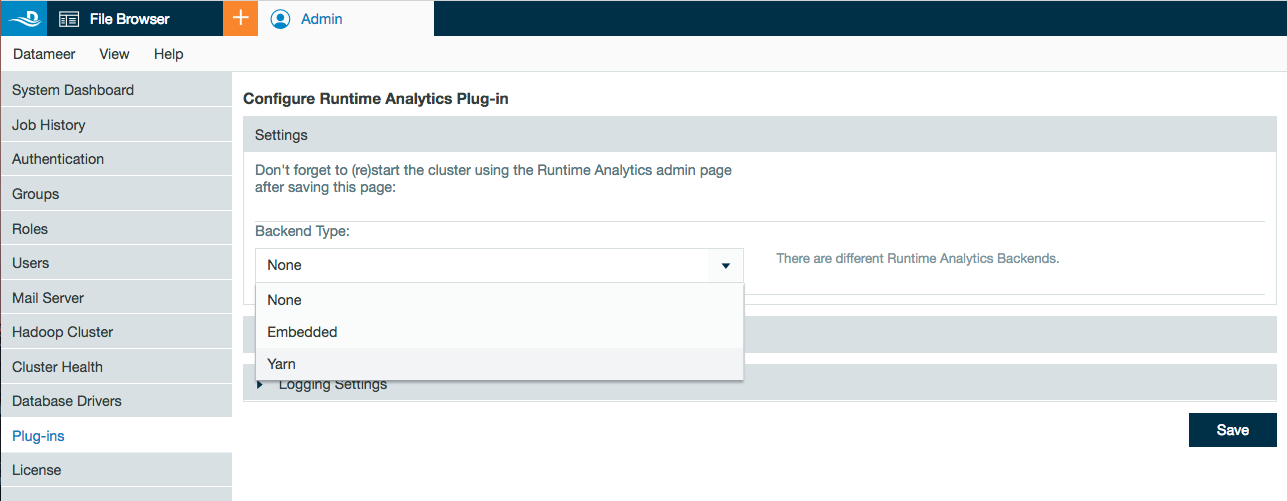
- Under settings, select Yarn as the backend type for a production environment. (The Embedded type can be used for testing and debugging on small datasets since it provisions RTA in same JVM as Datameer). Embedded mode is not recommended for production deployments.
- Configure additional settings for your specific environment. (See Capacity Planning below.)
- Click Save.
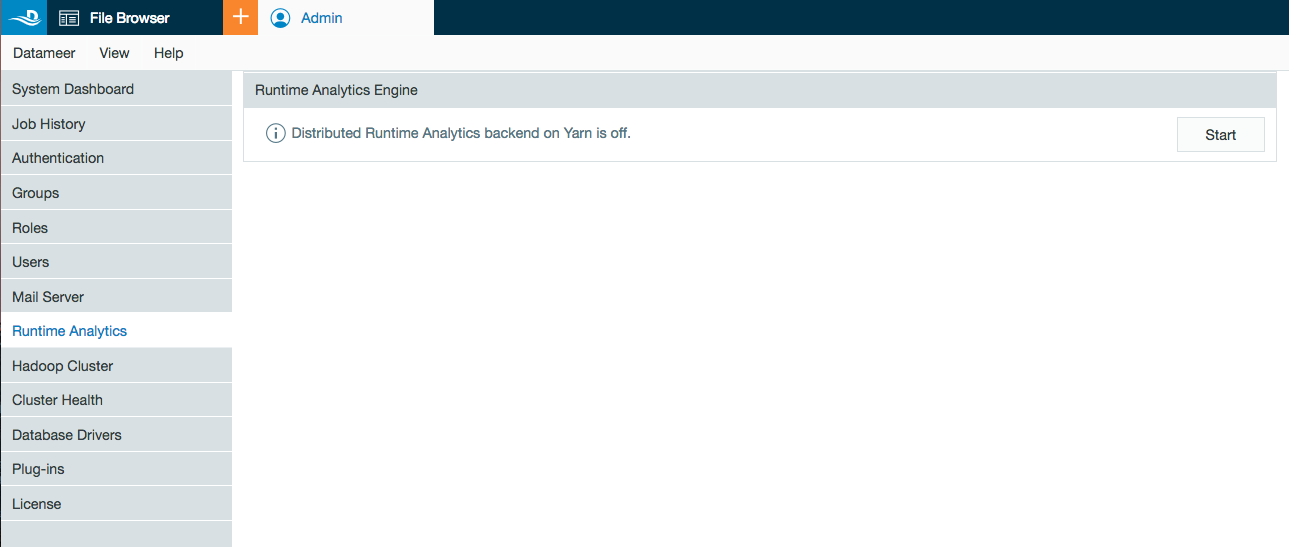
- Select the new menu option Runtime Analytics under the Admin Tab.
- Click Start to enable Runtime Analytics in Datameer.
Steps to stop Runtime Analytics
- Log in to Datameer through the user interface.
- Open the Admin tab.
- Select Runtime Analytics from the side menu.
- Click Stop.
Capacity Planning
Before deploying the Runtime Analytics Engine (RTA), plan resource allocation for the target use cases. This starts with your desired response time for targeted datasets. While there isn't a one-size-fits-all rule for using Runtime Analytics, these guidelines and examples provide guidance on a good starting point.
Before starting, it is important to understand that RTA deploys natively on Yarn as a "long-lived" Yarn application (See Deployment). This means that once the Datameer administrator launches RTA (see Configuring and Enabling Runtime Analytics), the RTA Yarn application occupies the configured amount of containers and memory for the duration the RTA Yarn app is live. In other words, unless there are other issues in the cluster that kill the Yarn app, the RTA Yarn app is active unless explicitly stopped.
Understanding data characteristics that impact capacity planning
When thinking about resource requirements, the number of records is an important dimension. There are other equally important dimensions such as the number of "active" columns, data types, and cardinality of such columns.
Number of "active" columns
Active columns refers to how many columns of a particular dataset the users are expected to use. Given that RTA indexes selected columns on demand, understanding what columns users could be expected to leverage can help plan if more memory should be allocated or if the datsets should be constrained to a smaller number of columns for visual exploration.
Data types & cardinality
Not all data types are created equal. For supported data types, cardinality (uniqueness) of data has a huge impact on the memory resources it uses once indexed into memory. At the highest level for this engine, there are two data types, numerics and strings.
- Numerics: include dates, floats, integers, and Boolean.
- Strings: the explicit string column in Datameer. RTA is design to handle string columns in the context of categorical information, not to handle large string columns for search purposes. RTA by default truncates text values to 16 characters, though it may be configured to allow up to 64 characters using the Maximum characters for prefix field in the advanced configuration for the plug-in.
- The Datameer list data type isn't supported by RTA. If you have data of this data type, the recommendation is to expand the lists in the workbook to a supported data type for analysis.
Memory planning
RTA loads into memory the columns users start to interact with (aka Active Columns) for aggregation and filtering operations. Since there are too many variables such as data types, the type of interaction with a column (filtering or aggregation), number of records, cardinality, lenght of characters for string columns, etc it is difficult to provide a single formula that covers all the different cases for sizing. The best way to plan memory capacity is to start with the largest datasets known that are planned for use with Visual Explorer. For this initial deployment for sizing you can use this very conservative formula: 1GB of memory per 2.5 million to 8 million records (assuming 10 active columns). Next, use the URL: http://<RTA Master Node>:9200/_parlenecache/stats?pretty (requires having Elasticsearch HTTP interface enabled in the plug-in configuration) so that a Datameer administrator can test potential columns of interest to get a sense how much memory is required for the largest dataset. Please note that additional user utilization for the same dataset doesn't increase memory requirements. See the Troubleshooting section below for additional information on finding the RTA Master Node URL.
Example:
You have a dataset with 100 million records. After testing different dimensions/measures of interest you learn that you need about 7GB of memory for touching 12 columns of this dataset. This is summarized by the top level "SumBytes" value with the URL above. This is the sample output from http://<RTA Master Node>:9200/_parlenecache/stats?pretty
{
  "SumBytes" : "6.9 GB",
  "EntryTypes" : [ {
    "name" : "TERMS",
    "SumBytes" : "1 GB",
    "Indices" : [ {
      "index" : "235_ca2a1a3c-2f0d-4f01-bdf1-c07557b8cccc_1216_np",
      "SumBytes" : "1 GB",
      "Fields" : [ {
        "field" : "nppes_provider_zip",
        "size" : "1 GB"
      } ]
    } ]
  }, {
    "name" : "SORTED_DOC_VALUES",
    "SumBytes" : "2.4 GB",
    "Indices" : [ {
      "index" : "235_ca2a1a3c-2f0d-4f01-bdf1-c07557b8cccc_1216_np",
      "SumBytes" : "2.4 GB",
      "Fields" : [ {
        "field" : "hcpcs_description",
        "size" : "227.8 MB"
      }, {
        "field" : "nppes_entity_code",
        "size" : "95.4 MB"
      }, {
        "field" : "nppes_provider_city",
        "size" : "288.8 MB"
      }, {
        "field" : "nppes_provider_state",
        "size" : "147.2 MB"
      }, {
        "field" : "nppes_provider_zip",
        "size" : "1.5 GB"
      }, {
        "field" : "provider_type",
        "size" : "96.7 MB"
      } ]
    } ]
  }, {
    "name" : "NUMERIC_DOC_VALUES",
    "SumBytes" : "3.5 GB",
    "Indices" : [ {
      "index" : "235_ca2a1a3c-2f0d-4f01-bdf1-c07557b8cccc_1216_np",
      "SumBytes" : "3.5 GB",
      "Fields" : [ {
        "field" : "date_of_service",
        "size" : "426.3 MB"
      }, {
        "field" : "medicare_allowed_amt",
        "size" : "770.2 MB"
      }, {
        "field" : "medicare_payment_amt",
        "size" : "770.2 MB"
      }, {
        "field" : "nppes_provider_latitude",
        "size" : "822.9 MB"
      }, {
        "field" : "nppes_provider_longitude",
        "size" : "822.9 MB"
      }, {
        "field" : "partition_column",
        "size" : "7.3 MB"
      } ]
    } ]
  } ]
}
Assume that after doing some other testing with other datasets, you conclude that you need 100GB of memory to fit all the datasets of interest in memory before the cache starts to cycle the in memory indices (LRU cache strategy is used). Datameer recommends to conclude the amount of memory needed to be the 100GB + 30% to 50% more to handle the unexpected and to have wiggle room to satisfy the Fields Cache Heap Fraction field requirement (this is found in the Advanced Settings for the plug-in configuration). RTA requires additional memory to operate outside of the memory it needs to hold on to the data. This means that once RTA uses the configured percentage amount of memory specified, it starts cycling the indexes in the cache.
With the example of 100GB of memory requirement for the dataset and a configuration value for Fields Cache Heap Fraction at 80%, that means that you would need about 125GB of memory configured for the Yarn app to support the 100GB memory requirements for the dataset (100/0.8). In addition, Datameer recommends configuring a few more GB to handle other datasets users might want to use with Visual Explorer, in this case 140GB would be a safer decision.
CPU planning
After understanding how much memory is needed for expected datasets (and adjusting for the unexpected), you need to start thinking about compute and parallelism. In order to get quick response times, you need to consider paralelism and CPUs. One way of looking at this is to think in terms of response times. Are you looking for response times in 2 seconds or less or would the business be happy with response times of 10 seconds or less? Datameer observed outstanding results in a few seconds (less than 5 seconds) when there is approximately a mapping between 1 vcore allocated per 2.5 million records. Datameer has also observed great performance numbers with response times between 3 and 8 seconds when allocating 1 vcore per 8 million records.
Before analyzing these details, it's worth understanding how Yarn applications behave and work with CPU resources. In general, Yarn is good at locking down memory resources while giving the freedom of using as many CPU resources as available for a given Yarn application. This is good news for RTA because due to traditional Hadoop workloads that tend to be intensive on I/O, this leaves CPU resources available. Now in Hadoop clusters where CPU resources are a bit constrained, you can also configure RTA to only use up to a fixed number of vcores in the server by changing the value of the Virtual CPUs per container field and checking the checkbox for "Elasticsearch processors" on the plug-in configuration screen.
Deciding on the number of containers
With a clear understanding of memory and CPU requirements for the desired datasets, the next step is to split this by the number of optimal containers for RTA deployment.
Generally, it is good practice to map 1 Yarn container per worker/slave node. Adding more containers than servers doesn't help and in some cases may make the response times slower as the workload increases for the same vcore count and the additional overhead.
Example 1
Using the example dataset in this document, you have 20 nodes with 16 vcores each and 64GB of memory assigned to Yarn. Hadoop administrators inform you that on average the cluster capacity is at 50% in terms of available containers with peaks around 75% with busy workloads.
- CPU: For optimal response times, you use the recommendation of 2.5 million records per vcore:
- Get an idea of how many vcores you have to work with: 20 nodes * 16 vcores per node = 320 vcores total.
- The largest dataset has 100 million records so you divide that by 2.5 million records per vcore and conclude that 40 vcores is sufficient to process 100 million records optimally.
- This equates to roughly 3 nodes rounding up (40/16=2.5) as a good estimate to start with.
- Since the cluster is used 50% on average, you can probably increase this to 5 nodes (almost twice as much).
- Memory: You previously concluded 140GB of memory is a good fit for the targeted dataset.
- With this assumptions you then assume that only half of the RAM will be available at any given time on average for RTA on a per node basis (32GB).
- Using 32GB as the baseline, divide that by 140GB and conclude that 5 nodes with 32GB of memory will be sufficient.
- Conclusion: Due to memory requirements, fitting all the targeted data requires 5 nodes.
Example 2
Using the example dataset in this document, you have 50 nodes with 12 vcores each and 32GB of memory assigned to Yarn. Hadoop administrators also inform you that on average the cluster capacity is at 80% in terms of available containers with peaks around 95% with busy workloads.
- In this type of case, it is recommended to provision additional Hadoop nodes to support RTA. But first, caculate based on the target datasets and desired response times.
- CPU:
- From the previous example, you know that you need 40 vcores to process 100 million records optimally.
- 40 vcores needed / 12 vcores per server (assuming they maintain the same compute densitiy with new hardware) = ~ 3.3 = 4 additional nodes.
- Memory:
- From the initial sizing, you figured 140GB are needed to fit the target data into memory.
- 140 GB / 32GB per node = ~ 4.4 = 5 additional nodes.
- Conclusion: Add at least 5 additional nodes to the cluster to support the targeted datasets.
Memory for RTA master node
RTA launchs one container that is assigned as the master node for RTA (See Deployment above for architectual reference). Generally, assign half the amount of RAM configured to the slave containers, but with a minimum of 2GB.
What is the impact of concurrent users?
As with most things search related, it can differ depending on the situation. The resources being shared are memory, CPU, and network. Of these three, network is unlikely to be the bottleneck unless the cluster has poor bandwidth.
Memory could be a bottleneck. If not enough container memory is allocated to keep the indexes for all active columns in memory at the same time, indexes get purged from the cache and require rebuilding which is a negative for both processing time and additional CPU usage (as well as additional network and I/O to reload). It is important to properly allocate the right amount of memory for the targeted datasets and to adjust resources for additional datasets.
CPU capacity has the highest probability of being the limiting factor. When optimizing for the best performance for largest datasets, you are diminishing the chances RTA calculates multiple requests at the same time. RTA can process concurrent requests and the impact on response times vary depending on deployment configuration. When deployment is optimized for the best performance for largest datasets, RTA should be able to handle 10 concurrent queries comfortably. It is important to understand though that concurrency is a function of the amount of resources allocated for RTA in the cluster.
Runtime Analytics REST API
The Runtime Analytics process can be started, stopped, and have the status checked though Datameer's REST API.
Security
- RTA deploys and it's compatible in Secured Hadoop clusters with Kerberos and Impersonation enabled.
- In Secured Hadoop clusters, the RTA Yarn application is launched as the Datameer service user.
- It is important to understand that the service user that launches the RTA Yarn application doesn't attempt to access data.
- Every query that comes from Visual Explorer is answered using the user in context through the authentication and Kerberos ticket information in RTA.
- In Secured MapR clusters, the maximum uptime of RTA is limited to the configured
yarn.mapr.ticket.expirationproperty in yarn-site.xml (default observed to be 7 days).
Limitations
Data types
- String columns: The length of a string is limited to the configured Maximum character for prefix field value. By default this is 16 characters and can be configured to 64. If the datasets have categorical data that exceeds typical datasets with 16 characters, change the value and restart RTA for the change to apply. See Capacity Planning above.
- List columns: Lists are not supported in RTA and list columns don't show as a column option in Visual Explorer. To work around this limitation, use the EXPAND function in the workbook to flatten out the data in the list. Note that this increases your data size. Consider additional data preparation steps if needed.
Datameer file types
Data links: To use Visual Explorer on data links, sheets in the workbook need to be marked as "kept" when the workbook is executed. RTA needs the data to be material in Datameer for columnar store requirements.
High cardinality columns
High cardinality columns can be defined as columns with more than 500 unique values. In search based technologies, queries on high cardinality columns might take a greater amount of time to process and use more memory resources.
Number of records in responses limitations
Some workflows in Visual Explorer can potentially ask RTA to return big chunks of data. As RTA is designed to answer analytical questions in context of aggregates, a guardrail is enabled for requests expecting more than 10,000 records. This includes aggregation requests on columns with a cardinality over 10,000 or requests for raw data that exceed 10,000 records.
Subdimensions
Queries with subdimensions are typically generated by adding color to the charts and are viewed in the color legend in Visual Explorer. Subdimensions are limited to the top 50 values for each primary dimension. This can be better understood by comparing outputs on a Visual Exploration sheet from RTA vs batch execution.
Schema changes in worksheets
Materialized data as the product of a workbook execution tighly couples the schema and the data. If you change the schema for a processed worksheet, you must run the workbook again before Visual Explorer is available for data exploration.
Logs and Troubleshooting
Common issues
RTA is too slow:
- Has proper sizing being done? See the Capacity Planning section.
- Ensure you select MultiParquetDataLoader in the Data loader field in Advanced Configurations. This ensures optimal parallelism when Datameer's job output writes one large part file.
- Have you used all configured memory? Delays can occur if new datasets start evicting other active indices in the memory cache. See the Capacity Planning section.
- Are you running on EMR? If so, note that the initial column reads and the Visual Explorer load time take longer than an on premise cluster due to EMR ↔ S3 latency.
RTA takes a long time to start
- This is a common occurrence when the configured amount of resources (number of containers and memory) aren't available at that point in time. The recommendation is to start RTA when it is known that the configured resources are available in the cluster.
Relevant log files
- conductor.log & runtime-analytics.log
- Useful to investigate problems with Runtime Analytics starting, stopping, or crashing.
- runtime-analytics-query.log
- Read this log to investigate problems with Runtime Analytics crashing, querys failing, or the wrong results being delivered.
Where is RTA Master Deployed?
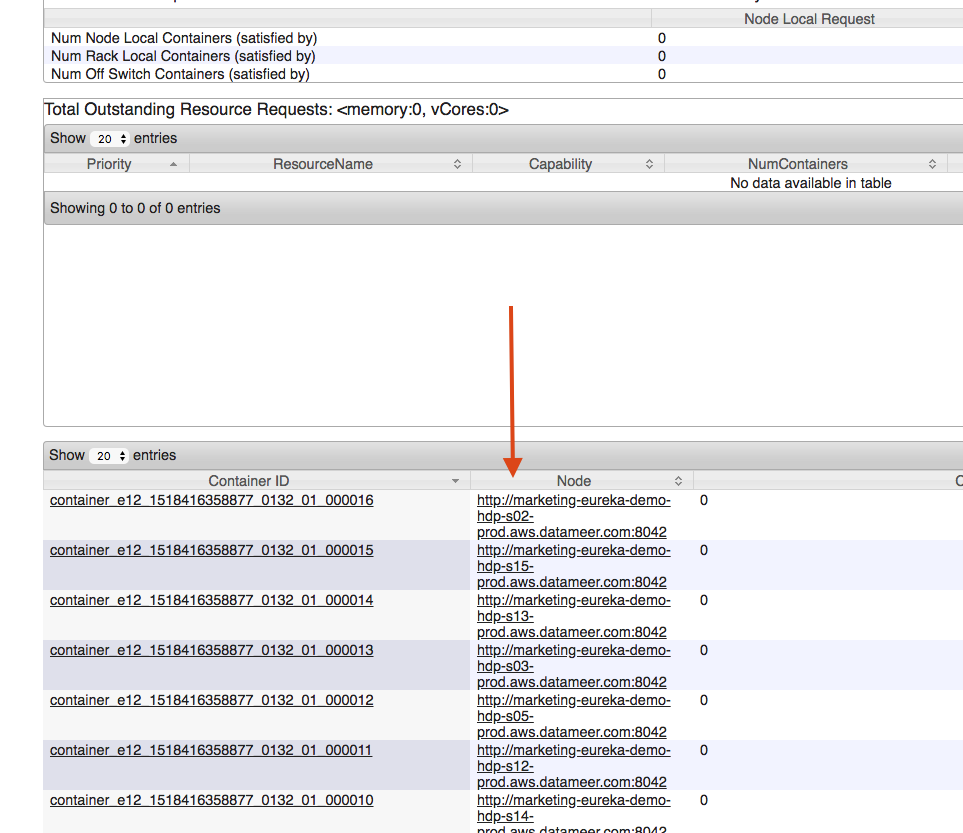
Once the RTA deployment is live, go to the Yarn App and copy a URL from one one the active nodes holding the container:
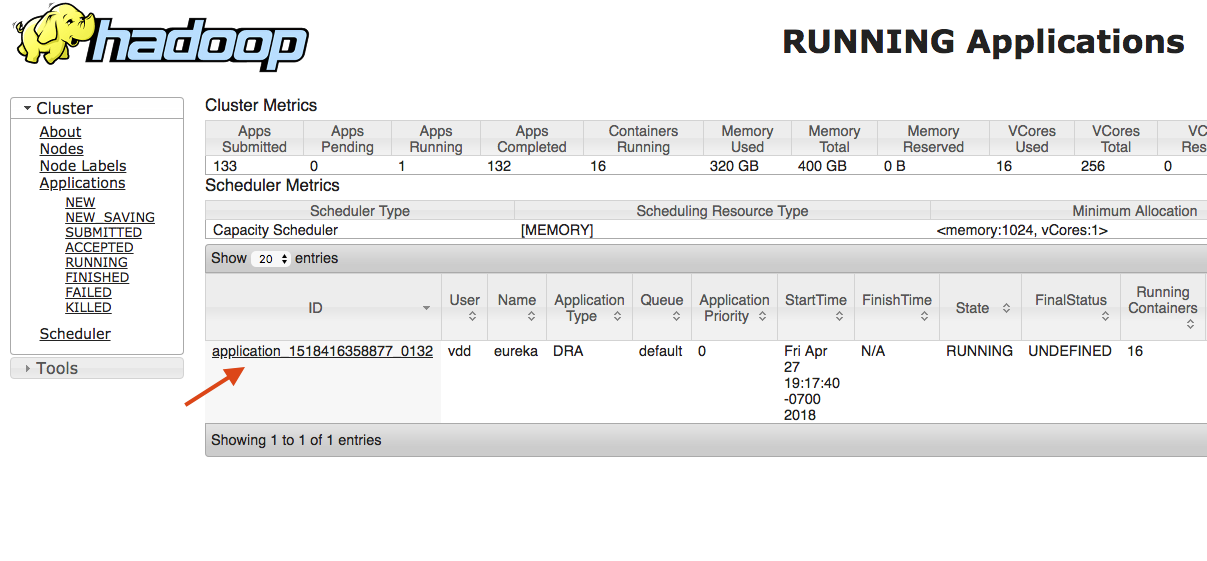
- Find the Yarn app with the application type DRA. This is the long-lived Yarn app for RTA. Click on the Application ID.
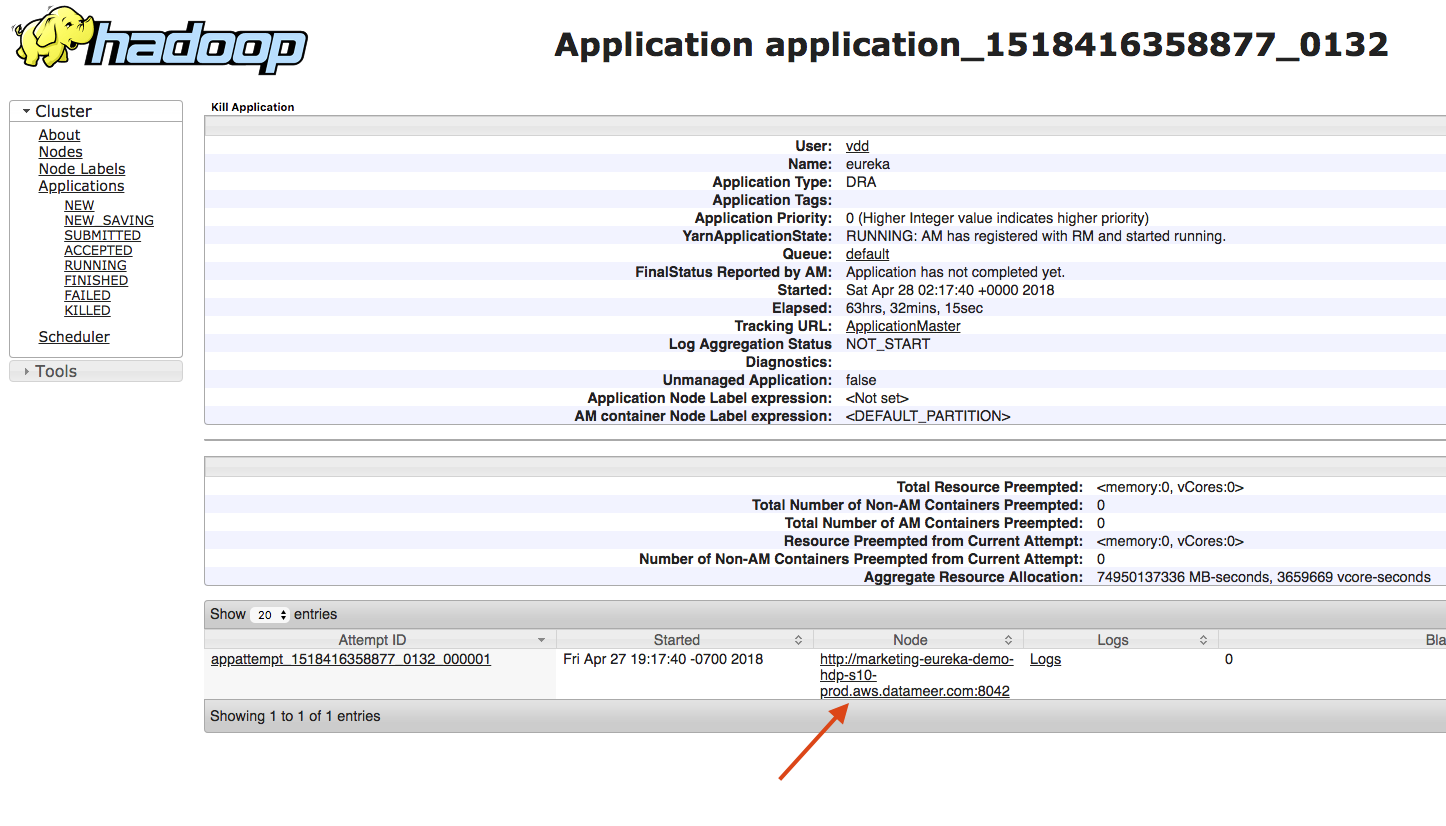
- Different attempts to launch the Yarn app are displayed on this page. Find the active attempt that succeeded and copy of the Node URL.
- Select the option below that applies to you:
- If you are in an intranet and you have access to that host, copy the URL to your clipboard and paste it in a new tab.
- If you don't have access to the internal network of the Hadoop cluster and can't tunnel into it (e.g., EMR Cluster with a locked down security group config),
- Copy the URL.
- SSH into the Datameer server that has access to all of the Hadoop nodes.
- Paste the URL in a wget statement. For example: wget http://<url>
- In both options:
- Dismiss the current port and use 9200.
- URL: The desired debugging URL. In this case use http://<URL>:9200/_cat/nodes?pretty
The output would similar to the example below. The IP with the "master" label would be the one of interest.
172.30.3.31 172.30.3.31  9 59 0.33 d - node-0132_01_000013_marketing-eureka-demo-hdp-s03-prod
172.30.3.36 172.30.3.36  9 54 0.00 d - node-0132_01_000014_marketing-eureka-demo-hdp-s13-prod
172.30.3.21 172.30.3.21  9 56 0.01 d - node-0132_01_000011_marketing-eureka-demo-hdp-s12-prod
172.30.3.25 172.30.3.25  9 56 0.11 d - node-0132_01_000016_marketing-eureka-demo-hdp-s02-prod
172.30.3.9  172.30.3.9   9 57 0.01 d - node-0132_01_000012_marketing-eureka-demo-hdp-s05-prod
172.30.3.6  172.30.3.6   2 99 0.02 - * master
172.30.3.13 172.30.3.13  9 57 0.06 d - node-0132_01_000006_marketing-eureka-demo-hdp-m01-prod
172.30.3.57 172.30.3.57  9 56 0.02 d - node-0132_01_000005_marketing-eureka-demo-hdp-s08-prod
172.30.3.62 172.30.3.62  9 53 0.00 d - node-0132_01_000015_marketing-eureka-demo-hdp-s15-prod
172.30.3.15 172.30.3.15  9 55 0.05 d - node-0132_01_000008_marketing-eureka-demo-hdp-s07-prod
172.30.3.32 172.30.3.32  9 56 0.16 d - node-0132_01_000004_marketing-eureka-demo-hdp-s04-prod
172.30.3.49 172.30.3.49  9 55 0.02 d - node-0132_01_000010_marketing-eureka-demo-hdp-s14-prod
172.30.3.60 172.30.3.60  9 56 0.03 d - node-0132_01_000009_marketing-eureka-demo-hdp-s09-prod
172.30.3.4  172.30.3.4  10 54 0.00 d - node-0132_01_000002_marketing-eureka-demo-hdp-s06-prod
172.30.3.14 172.30.3.14  9 56 0.01 d - node-0132_01_000007_marketing-eureka-demo-hdp-s01-prod
172.30.3.17 172.30.3.17  9 41 0.03 d - node-0132_01_000003_marketing-eureka-demo-hdp-s11-prod
(Optional)
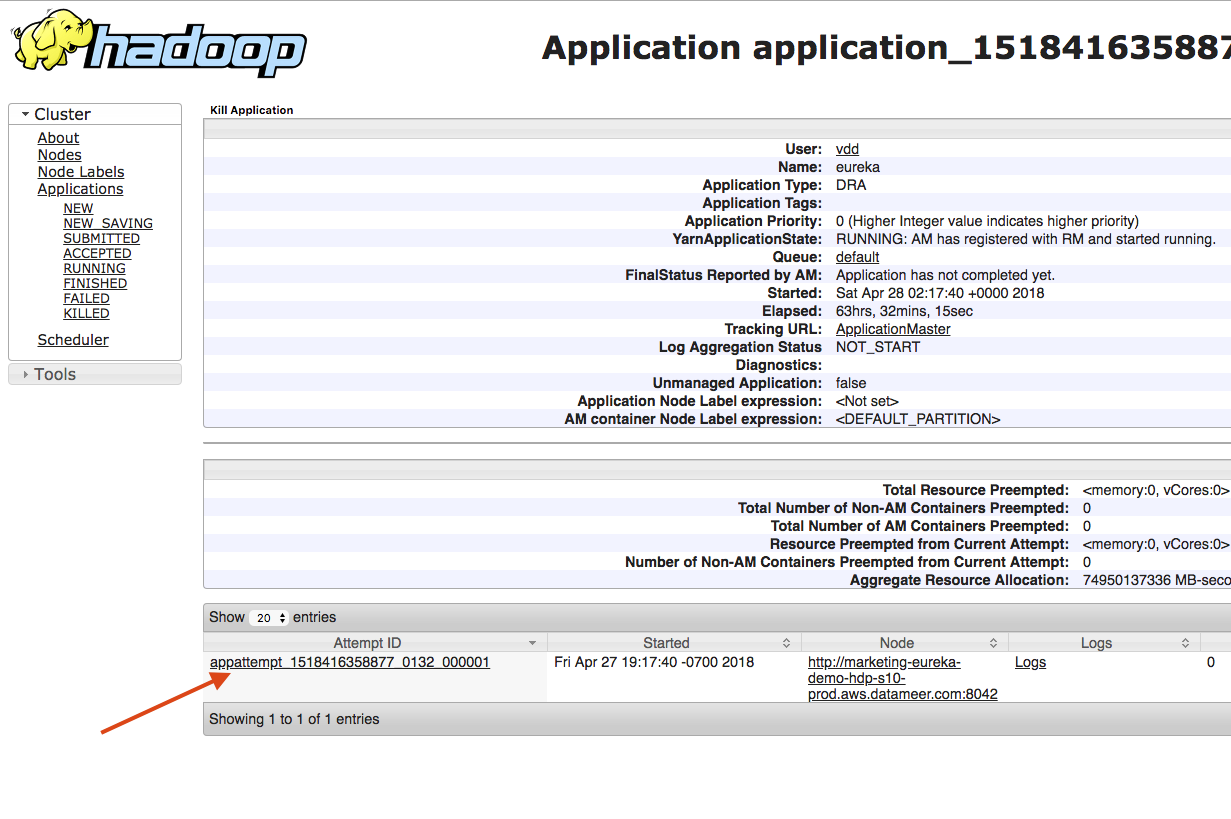
- If the URL used doesn't work, use the _cat/nodes?pretty URL from any other node that has RTA deployed. Do this by clicking on the Application ID link that gives you details of what containers are deployed and their respective nodes.
- On the following displayed page, scroll down and find the node URLs for that Yarn app.
- If the URL used doesn't work, use the _cat/nodes?pretty URL from any other node that has RTA deployed. Do this by clicking on the Application ID link that gives you details of what containers are deployed and their respective nodes.
Support
If additional help is needed, print the above logs and contact support@datameer.com

