Flip Side
- Charles Bishop (Deactivated)
- Judy Bergstresser (Deactivated)
hoFlip Side is a useful analytic tool built directly into Datameer workbooks. This feature gives you instant measurements from every sheet in your workbooks. It's a way to get a quick visualized data overview with a click rather than having to perform the calculations manually.
Accessing Flip Side
- Open a workbook.
- Navigate to the sheet.
- Open the Flip Side analytics by going to View and selecting Flip Sheet, or click the Flip Sheet button.
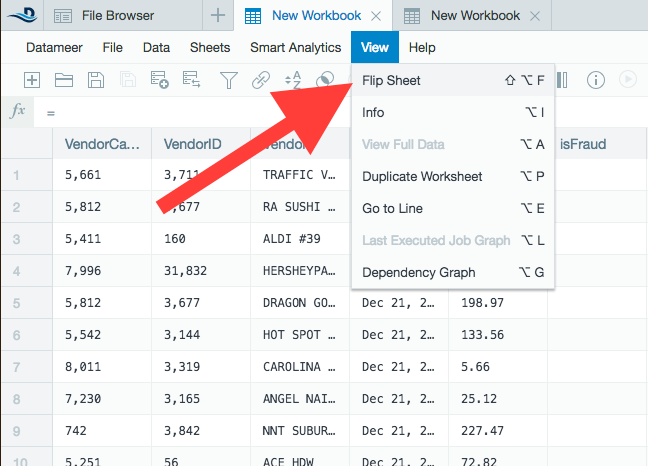
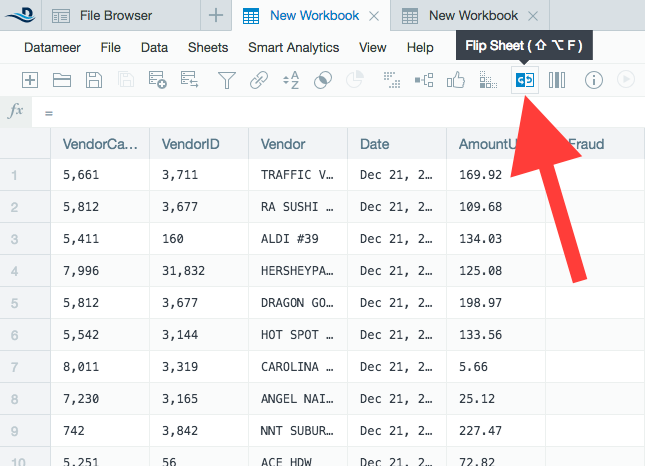
The Flip Side analytics from the sheet are displayed.
Find if the Flip Side is Running from Full or Preview Data
Datasource
When viewing a sheet from a datasource, the Flip Side calculates the full data from the data source. Column metrics are provided by the import job.
Calculation sheet
When viewing a Flip Side sheet that is a calculation, join, or union the Flip Side calculates preview data until the workbook has been processed. Column statistics are based on preview data only. Run the workbook to see full data.
Worksheet linked from a separate workbook
When viewing a Flip Side sheet that is a sheet linked from a different workbook, the Flip Side calculates preview data until the external workbook has been processed. Column statistics are based on preview data only. Run the workbook to see full data.
Data link
When viewing a Flip Side sheet from a data link source, the Flip Side calculates preview data only. Full data is not available from a data link source. Column statistics are based on preview data only. Full data statistics are not available for unkept data link sheets.
Reading Flip Side charts
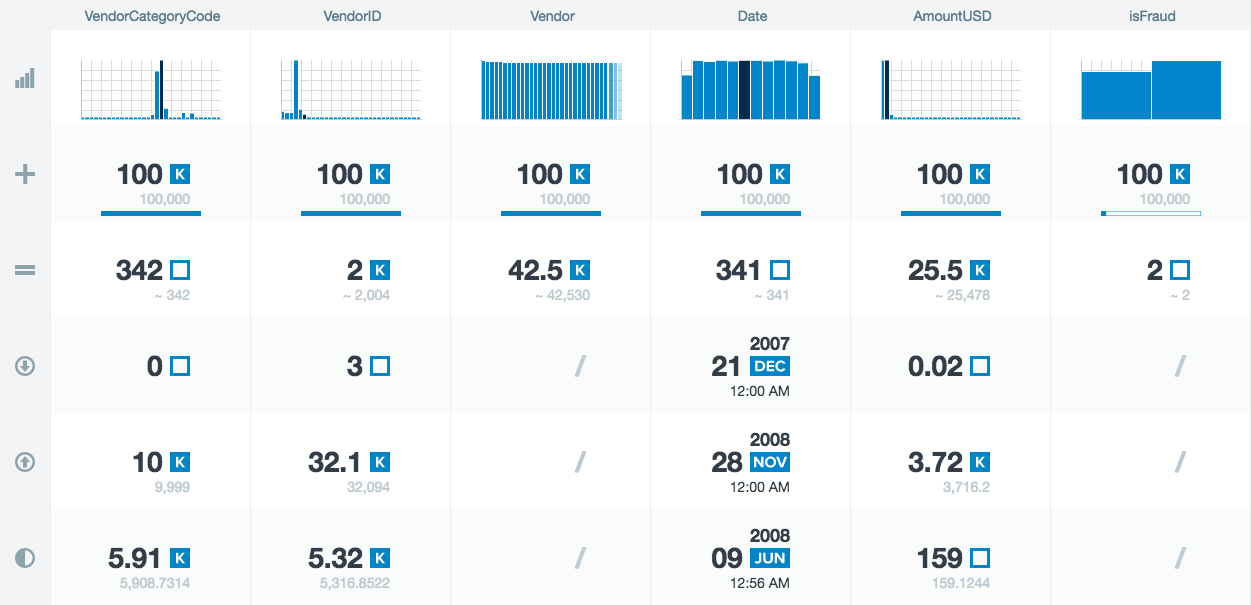
The Flip Side charts show pre-calculated analytics of a worksheet based on either the preview data or full records. These metrics give users insight into a quick summary of the worksheet. The tilda symbol (![]() ) indicates that the number shown is an approximation.
) indicates that the number shown is an approximation.
Categories of worksheet metrics
![]() The Distribution row displays a histogram of each column separating data into relevant groups. Running the mouse cursor over the histogram displays the group size and count.
The Distribution row displays a histogram of each column separating data into relevant groups. Running the mouse cursor over the histogram displays the group size and count.
 The Count row displays a rounded count of records for easy visibility, the exact number of records, and a bar showing the number of empty records - the fraction of empty records is shown as a white colored section of the bar.
 The Unique row displays an estimated, rounded count of unique records and an estimated number of unique records of a column.
![]() The Min row displays the lowest number of a row. If the data field is a date, the earliest date is displayed.
The Min row displays the lowest number of a row. If the data field is a date, the earliest date is displayed.
 The Max row displays the highest number of a row. If the data field is a date, the most recent date is displayed.
![]() The Mean row displays the average number of a row by adding the records and dividing by the number of records (including empty records). If the data field is a date, the date directly between the earliest and most recent date is displayed.
The Mean row displays the average number of a row by adding the records and dividing by the number of records (including empty records). If the data field is a date, the date directly between the earliest and most recent date is displayed.
Flip Side Calculations (Advanced)
The following information gives greater detail how Flip Side calculations are created.
Numerical histograms
Histograms on a Flip Side sheets that represent numbers with very few unique values are displayed categorically as opposed to a range. This change better represents the data so analysts are given a clear view of the data's shape. These are approximate, not exact, values. (To compute the exact count, use the GROUPBYBIN and GROUPCOUNT functions in a workbook.)
How the x-axis is calculated for numerical data
- Up to 32 most frequent bins.
- Breaks are found by splitting from minimum to maximum into 32 equal width bin bars.
How the y axis is calculated for numerical data
- Shows the count of how many records fall in the range of that bin.
- Shown is an estimate of the true count, (not sampling) due to single pass over data.
Non-numerical (categorical data) histograms
These are approximate values. Datameer populates the histograms using a single pass over the data. A single pass top k algorithm is used to determine the categories for the bins.
How the x-axis is calculated for categorical data
- Uses all possible different values to make the bins.
- If greater than 32 values exist, the 32 most frequent are used to make the bins.
How the y-axis is calculated for categorical data
- Shows the count of the number of records of the bins.
Empties and nulls
Histograms
In the histogram, null values are ignored. Empty strings can be used as a bin.
Count
Records with null or empty values contribute to the count. Hovering over the bar shows how many were null (but not empty even though it says "empty").
Unique (cardinality)
Null values don't contribute to unique. Empty strings do contribute.
Minimum, maximum, average
Null is ignored for minimum, maximum, and average.
How estimates are calculated
Data shown on the Flip Side is based off the full data if the workbook has been run. Otherwise, it is based on the sample data.
Flip Side permissions in a workbook
If you have view access to a workbook, you can see any Flip Side in the workbook.
Special Flip Side Data for Smart Analytic Sheets
Administrators
Administrators have the ability to disable full metric calculations for reasons such as controlling performance characteristics.
Disable individual job metric calculations
When configuring an import job or workbook, open the advanced settings and enter the property das.compute.column-metrics=false in the Custom Properties field.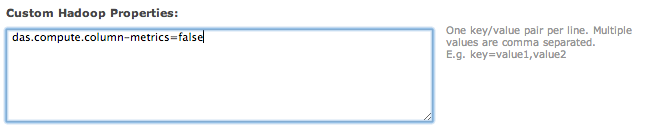
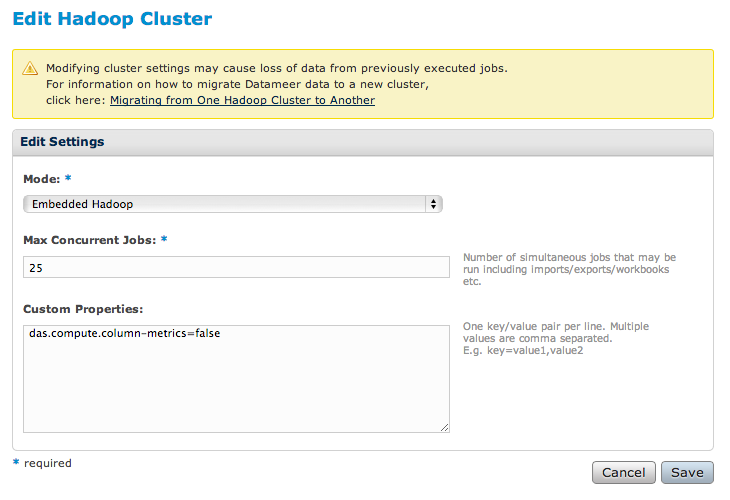
Disable all job metric calculations
Edit Hadoop Properties under the Admin tab. Enter the property das.compute.column-metrics=false in the Custom Properties field.
The Flip Side is available, but only from preview data. Column statistics are based on preview data only. The statistics computation have been disabled for the import job (Contact system administrator).