Recommendations
What are Recommendations?
The recommendation engine automatically predicts the interests of a person based on historical observations of other people’s interests. Use this smart analytics tool to increase engagement, recommend more relevant choices, increase customer satisfaction, and more.
Recommendations example
Open a workbook to the worksheet you would like to analyze with Datameer's Smart Analytic recommendations tool.
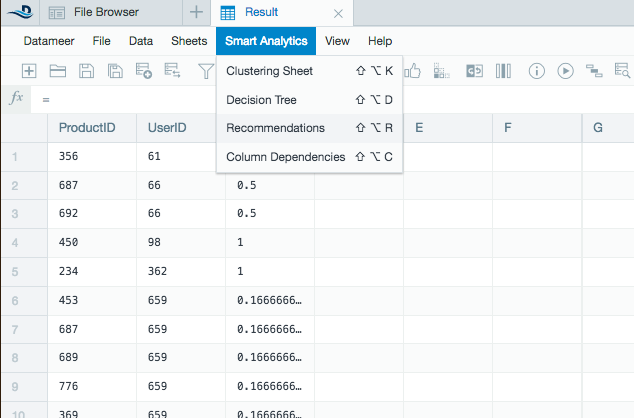
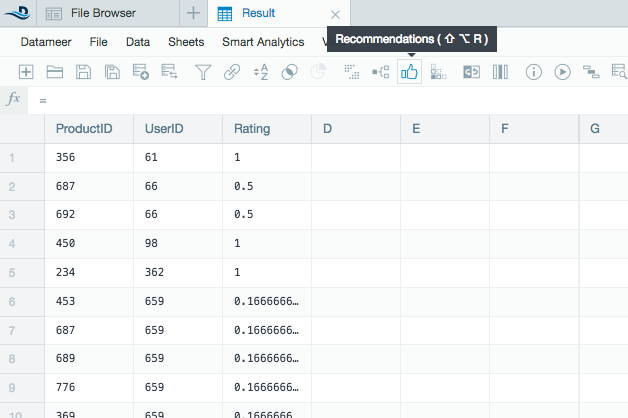
- Select Smart Analytics from the top and then select Recommendations from the drop down menu or click the Recommendations icon on the tool bar.
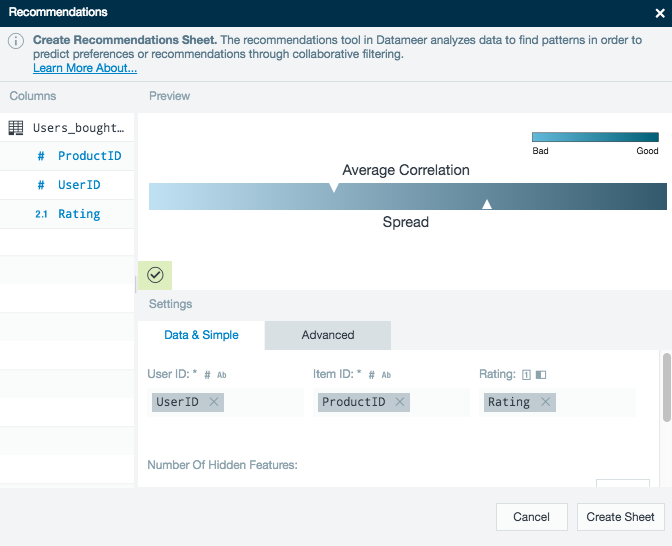
- A recommendations wizard pops up. Drag and drop the columns for a User ID, Item ID, and the user's Rating for the item to the corresponding field. If you leave Rating blank it generates as follows:
- A constant rating value of one for all existing user-item-transactions.
- A constant rating value of zero for all non-existing transactions.
Set the number of Hidden Features and Top Recommendations (see below).
Top Recommendations - This is the number of recommendations to calculate for each user.
Hidden Features - The algorithm runs a matrix factorization that learns for each user and each item a set of features. The bigger the number of hidden features, the more complex the model gets. The more complex the model the longer the computation time is. The number of hidden features shouldn't be set too high since a very complex model is also prone to overfitting.
- The recommendations algorithm runs to determine the recommendations for each user based on the user rating data and set number or hidden features.
- A preview graphic displays a bar indicating how good the recommendations are based on the Average Correlation and Spread. The farther to the right both pyramids are, the stronger the recommendations are as determined by Datameer.
- Average Correlation - How similar the connection is between the hidden features rankings. The more unique the hidden features are, the better to define recommendations.
- Spread - How similar the gap is between recommendation ratings. The smaller the distance between recommendation ratings, the lower the spread is. Datameer defines the spread as being good for the quality of recommendations when the distance between recommendations ratings is small.
- See Advanced Settings to further analyze recommendation data.
- Click Create Sheet to bring the data to a new sheet in the workbook.
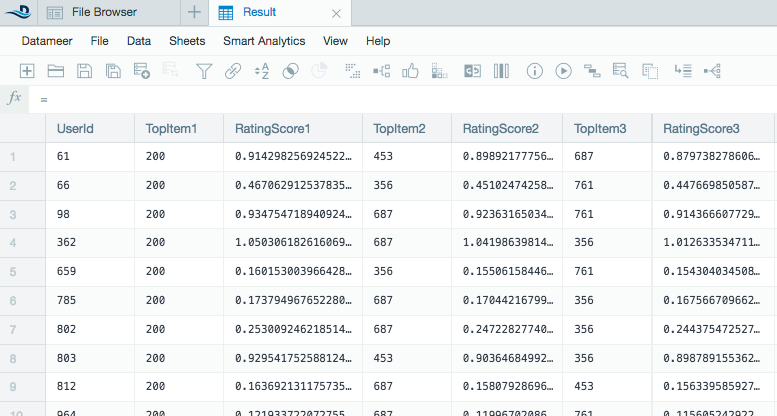
- The new worksheet contains the user, the recommended items, and the strength of the recommendation.
- The higher value of the rating score, the stronger the recommendation for a specific item.
Advanced recommendation settings
Use these advanced settings to further enhance recommendation data.
Number of Iterations: Select the number of times to use the method of alternating least squares iterations on the data. The more iterations performed increases finding the optimal recommendations. Also, more iterations performed increases calculating time.
Lambda: Adjusts parameters to account for sparse data. Large sparse data usually results in overfitting. To avoid overfitting, a regularization term is introduced to the formulas. Adjust lambda to find a value that results in a not too complex and not too simple model. The preset value of lambda=0.065 has shown to be good for many situations.
Filter Training Data: Checking to filter training data insures that items that the user has rated isn't recommended to the same user.
Number of Density Strip Bins: Defines the number of separate group compartments on the density strip graphic.
Recommendations Flip Side analytics
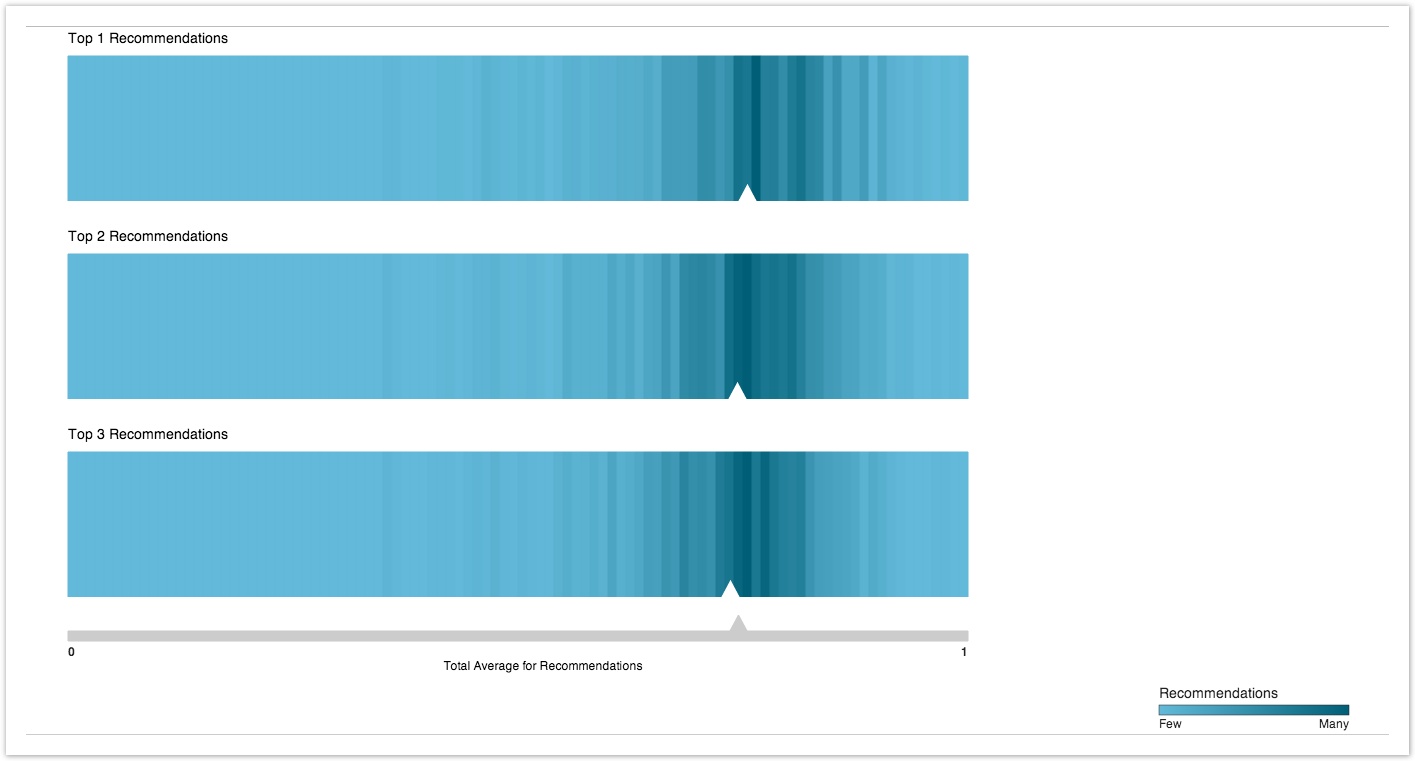
Use the Flip Side feature of the Recommendations tool to view the density of ratings for a given number (N) of recommendations.
- The ratings are arranged in ascending order. The lowest ratings are at the far left and the highest ratings are at the far right.
- The greater the density, the more recommendations there are for that given rating.
- The triangular white marker shows the average rating for the given N recommendations. The higher the average recommendation score, the better likelihood that those N recommendations are good ones.
You can also create a workbook with a recommendation system purely based on co-occurrences (no ratings required) without using Smart Analytics.
