Create a Legend for a Widget
- Juliane Wetzel (Unlicensed)
Default Legends
Many infographic widgets have the option of adding a legend.
Default legend settings
- Add a widget to your infographic dashboard.
- Select the widget.
- Open the specific settings of the widget.
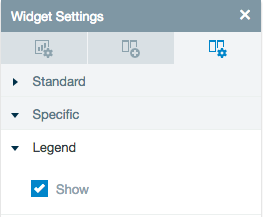
- From the specific settings:
- Choose if you would like to display the default legend.
Default legend personalization
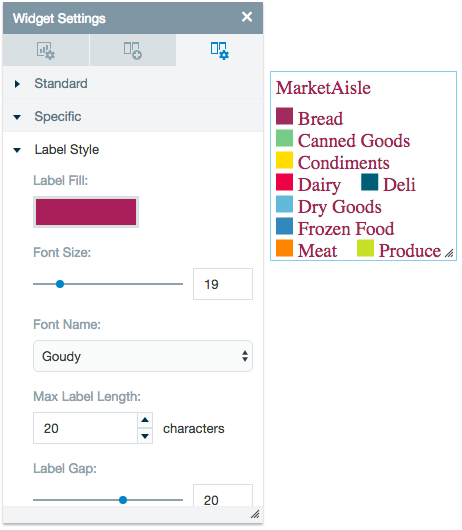
The default legends settings can be configured to best match your infographic style.
- Select the legend on your infographic dashboard.
- Adjust the specific settings to create a personalized legend.
Creating Your Own Legend
The default legend might not be exactly right for your infographics, so you can create legends manually using Datameer's infographic tool set. You have complete control on the type of legend style that works best for your needs.
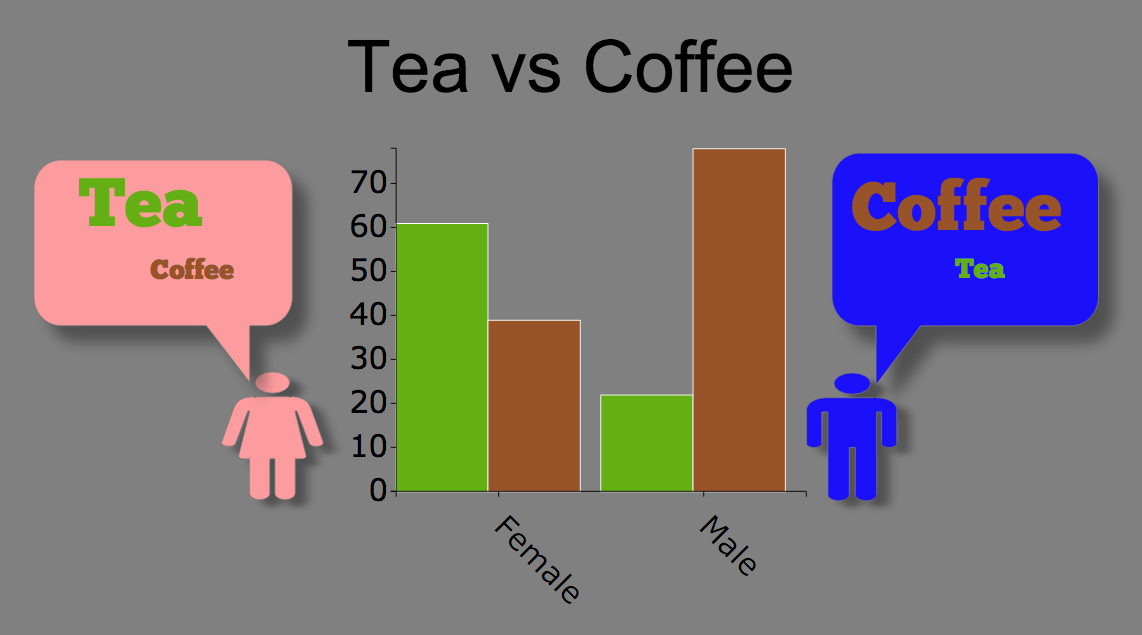
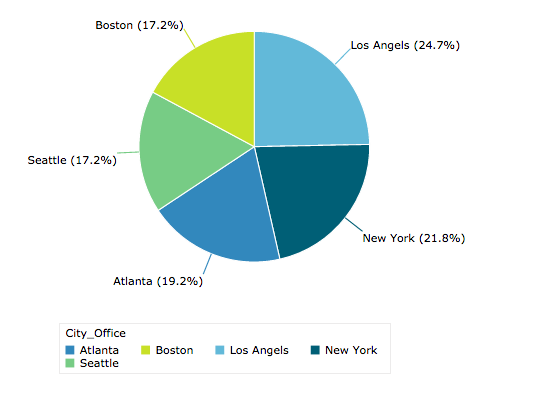
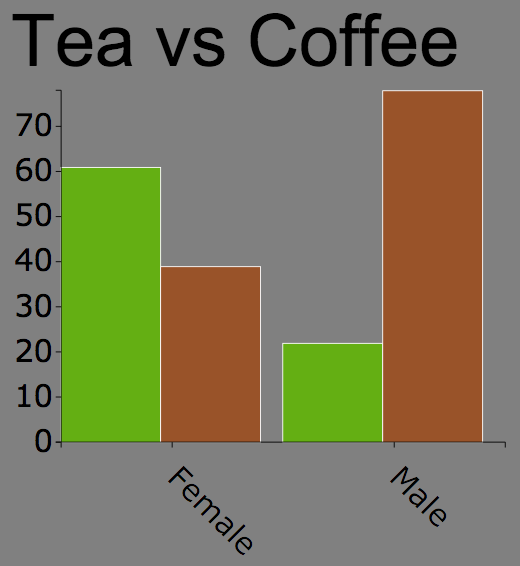
Example
You created a graph or chart and now want to add a legend to define and accentuate the data.
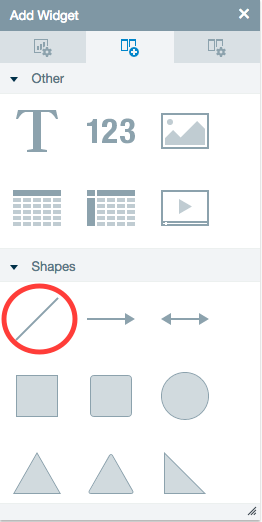
Open the available widgets and scroll down to the Others and Shapes categories. For this example you choose a simple line shape to create the legend. Drag and drop this widget onto your workspace next to your chart.
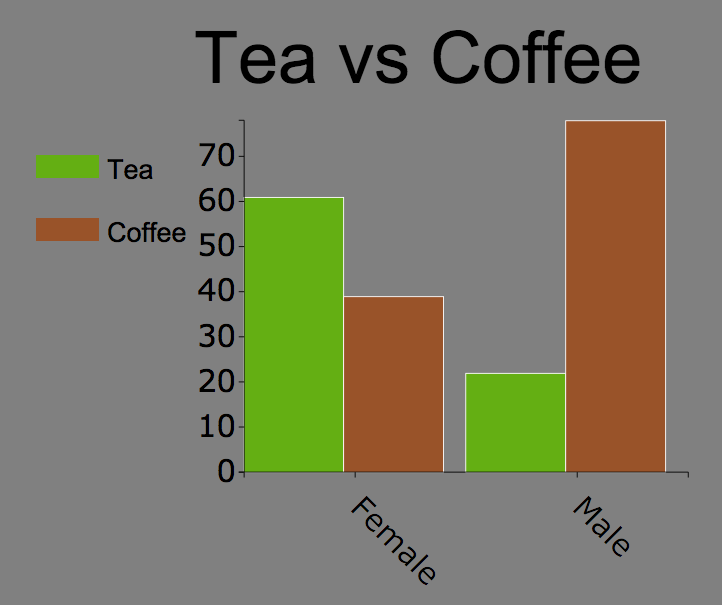
Now you can adjust the widget settings for this shape to match your chart. In this example, the line is adjusted to the proper size and matched with the color on the chart it represents.
A text widget from the Others widget category is used to add descriptive text completing your legend.
Advanced example
Datameer X has many widget options and tools and all of these options have adjustable settings. This gives you the power to fully customize your legends to suit their individual needs.