Introduction
Datameer builds on the power and scalability of Apache Hadoop to deliver big data analytic solutions that are easy to build as well as being cost efficient. Datameer integrates rapidly with existing and new data sources to deliver sophisticated analytics. Datameer tools simplify extraction, transformation and loading, and real-time data retrieval.
The Datameer approach is focused on ease of use for business users without imposing an additional load on the IT organization.
- A familiar interactive spreadsheet interface allows you to easily navigate and analyze large data volumes
- Over 175 built-in functions offer business users powerful, but easy-to-use data analytics for exploring and discovering complex relationships
- Drag & drop reporting and charting facilitates the effortless creation and customization of personalized data visualizations (infographics)
- Plug-in API supports building custom functions
Use Datameer to analyze customer relationship management content, web logs, customer data, sales data, social media content, and even data from Excel files. You can store that data on your own servers or use a service available on the cloud such as Amazon Web Services.
Datameer provides a familiar interactive spreadsheet-based interface that is easy to use, but also powerful so that you don’t need to turn to developers for analytics. The spreadsheet is specifically designed for visualization of big data and includes more than 200 built-in functions for exploring and discovering complex relationships. In addition, because Datameer is extensible, you can use functions from third-party tools or write your own commands.
Datameer's Business Infographics tools include charts, graphs, maps, and allows you to incorporate your own visual elements to produce stunning, print-quality data visualizations.
Datameer Architecture
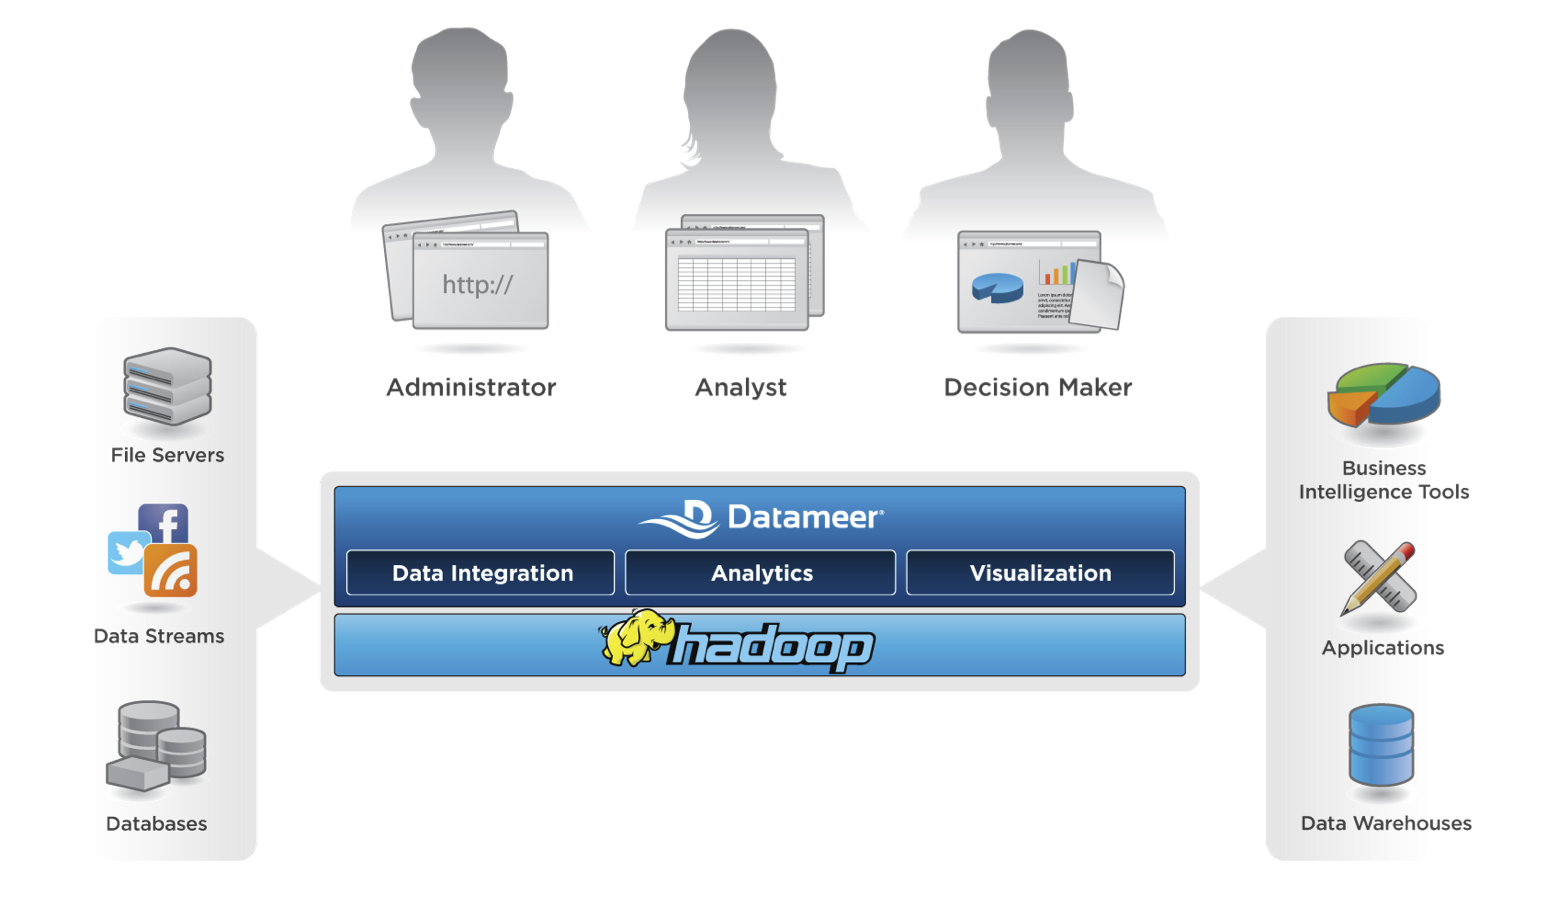
Your existing data feeds into Datameer where Hadoop manages and distributes both the data and the computational load over multiple computers networked together.
The Datameer tools allow you to easily Extract, Transform, and Load (ETL) data from multiple sources including your current transactional database systems regardless of source or formats. Then you can analyze relationships in the data using an interactive spreadsheet interface and visualize the results of that analysis using the built-in infographic widgets.
Datameer is specifically designed to solve the challenges of accessing, analyzing and using massive amounts of data, leveraging Apache Hadoop open source technology. Datameer enables enterprises to gain insights from all available data sources regardless of size in a cost effective manner.
Massively parallel processing architecture facilitates ultra-fast performance of complex analytics. Hadoop scales to 4000 servers and petabytes of data and the application processes are fully parallelized inside Hadoop clusters. This dynamic workload optimization utilizes hardware more efficiently.
Datameer includes built-in fault resilience for high application availability, and elastic expansion to dynamically expand storage capacity without system downtime. The advanced data compression increases performance and decreases storage requirements.
Connect to Various Types of Data
Each type of data is set up as a connection so it can be used by Datameer. For example, you can have sales data from an Oracle or MySQL server, other content from a CSV file exported from Excel, twitter feeds about your company and products, and customer call logging data from yet another source. You can easily pull all that information into Datameer.
Process and Analyze Data
You create a workbook in Datameer that connects to one or more of these sources of data which you can then use to do analysis. For example, you could use sales data from your corporate database, twitter feeds, customer call logging data--all from different sources as the basis for your analysis. See Working with Workbooks to learn how to connect to one or more data sources.
Visualize and Export Data
The data saved with a workbook is available for use when visualizing data or when creating an export job. You choose what data gets saved in the Save Workbook settings page. See Working with Workbooks to learn more.
Optimize Performance
By saving only the information you need, you can conserve disk storage space and reduce the time needed to calculate your jobs. In the Save Workbook settings you can discard the intermediate steps. See Working with Workbooks to learn more.
System administrators can also optimize performance by optimizing the configuration of the Hadoop cluster. See the Hadoop and Datameer page.
Data Storage
Datameer preserves state information in the File Browser's localStorage for workbooks, including column view information such as width, position, etc. For infographics, Datameer preserves revision states for undo/redo operations and to prevent losing unsaved changes when refreshing the browser page. At no point does Datameer store actual data in the browser cache.
The time frame of data storage is dependent on the browser's cache settings. As with any data stored in the browser cache, it can't be accessed by other websites or applications, but is visible for anyone with direct access to the computer.

