Working with Sheets, Columns and Cells
Working with Sheets and Columns
You can set up sheet names, resize columns, collapse and show columns, rename worksheets, import worksheets from other workbooks, and more.
Displaying sheet dependency (graph overlay)
The graph overlay feature provides a graphic display of the currently selected sheet and any ingoing and outgoing sheets.
- View the sheet dependency overlay by clicking the Sheet Dependencies button in the toolbar. The currently selected sheet will be highlighted in the middle of the graph.
- To navigate between dependent sheets, click the sheet name located on the graphic overlay.
- To close the sheet dependencies overlay, click the toolbar button or click X on the current sheet.
Column names
When a user creates new columns using the Formula Builder, Datameer X creates default column names based on the column name in the formula, and the formula type.
Column names in workbook sheets that are editable can be renamed. The status line just above the list of tabs indicates whether a particular sheet is editable.
The following applies:
- Column names can only contain capital or lower-case characters, numbers, and underscores.
- A column name cannot begin with a number.
- All column names, in all workbook sheet types, are case sensitive, e.g. column names foo, FOO, FoO and fOO will be unique columns within the same worksheet.
To edit a column name:
- Right-click on the column name and click Rename.
- Enter the new name and press Enter.
- To undo the change, right-click the name again and click Undo.
Cell context menu options
To access the cell context menu, right-click on a cell within a workbook.
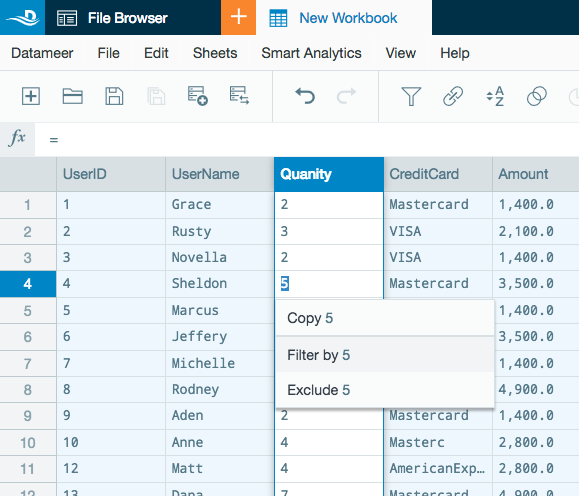
The cell context menu includes three options:
- Copy - Copy the cell value to the clipboard.
- Filter by - A shortcut to open the /wiki/spaces/DASSB70/pages/33036122637 and auto completes the fields using the equals expression to filter for matches the cell's value.
- Exclude - A shortcut to open the /wiki/spaces/DASSB70/pages/33036122637 and auto completes the fields using the does not equal expression to filter for matches that don't match the cell's value.
Formatting columns
To format the contents of a column:
- Right-click a column name.
- Select Format Cells.
- General
- Column text color
- Column background color
- Column text alignment (right, left, center)
- Numbers
- Thousands separator (comma to separate numbers by thousand)
- Select the amount of decimal places to display in the workbook
- Date
- Input a /wiki/spaces/DASSB70/pages/33036123836 to display the date. (The default doesn't display milliseconds)

Shading rows in a workbook
The worksheet highlights rows by each group series when a /wiki/spaces/DASSB70/pages/33036122130 function is used. 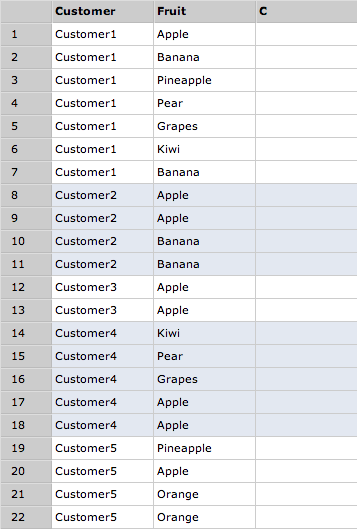
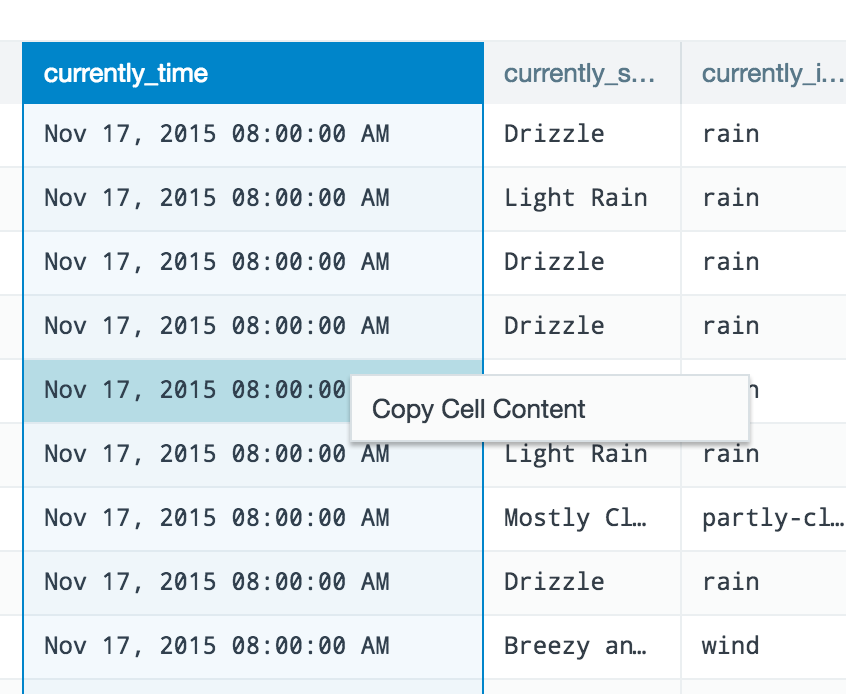
Copy cells
Double-click a cell to select it, and then right-click it and select Copy Cell Content to copy its contents to the browser's clipboard. This functionality doesn't work with the Safari browser.
Workbook inspector
The inspector gives you important information about the data of each column in your workbook. Use this feature for quick insights into the data that each of your columns contain.
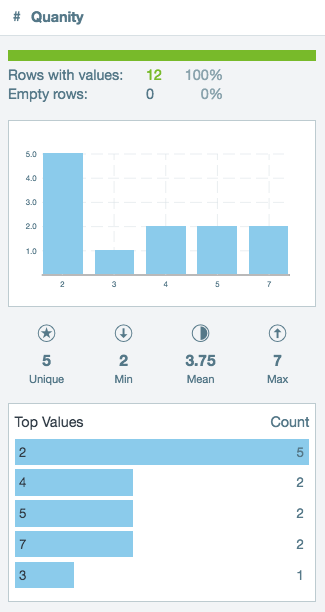
Information displayed in the column inspector:
- The name of the column being inspected.
- The number and percentage of valid and empty rows.
- A vertical bar chart displays all the different values and their frequency.
- Mousing over a bar in the chart displays the value(s) and count.
- If there are over 32 unique number type values, the bars group the values in bins.
- If there are over 32 unique non-number type values, the vertical bar chart is not displayed.
- The middle row of statistics displays the column's count of unique, minimum, mean, and maximum value.
- Mousing over a value displays the full value.
- Number and date field types are display all values. Other field types display only the unique count.
- The bottom horizontal bar chart displays the top unique values for the column and their respective counts.
- Mousing over a bar in the chart displays the value and count.
- Click the See more link below the bar chart to view additional column values in descending order.
As of Datameer X 7.2
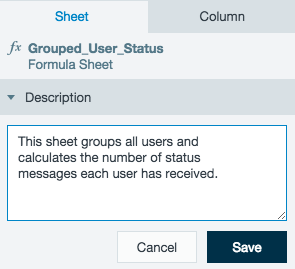
There are two tabs at the top of the workbook inspector. The inspector is separated at the worksheet level and column level.
The worksheet level tab has a description box where text can be entered about each worksheet in the workbook.
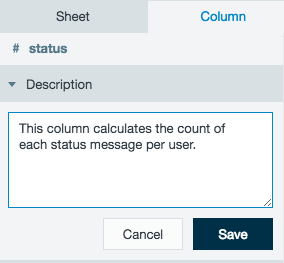
The column level tab has a description box where text can be entered about each column of a worksheet. Below the description box, the column information is as described above.
To open or close the workbook column inspector:
- Click View in the menu bar and select/unselect Inspector.
- Click the Inspector icon in the tool bar.
![]()